How do you graph the inequality # y> -1# and #x>=4#?

1 Answer
Jul 2, 2017

Let's start with #y > -1#. This is saying #y# is larger than #-1#. So the range goes from #-1# to infinity, or #(-1, oo)#:

graph{y > -1}

Note that #-1# is not included. That's what the dotted line means.

#x >= 4# tells us that #x# is greater than or equal to #4#

So the domain is from #4# to #oo#, or #[4, oo)#, with a solid line:

graph{x >= 4}

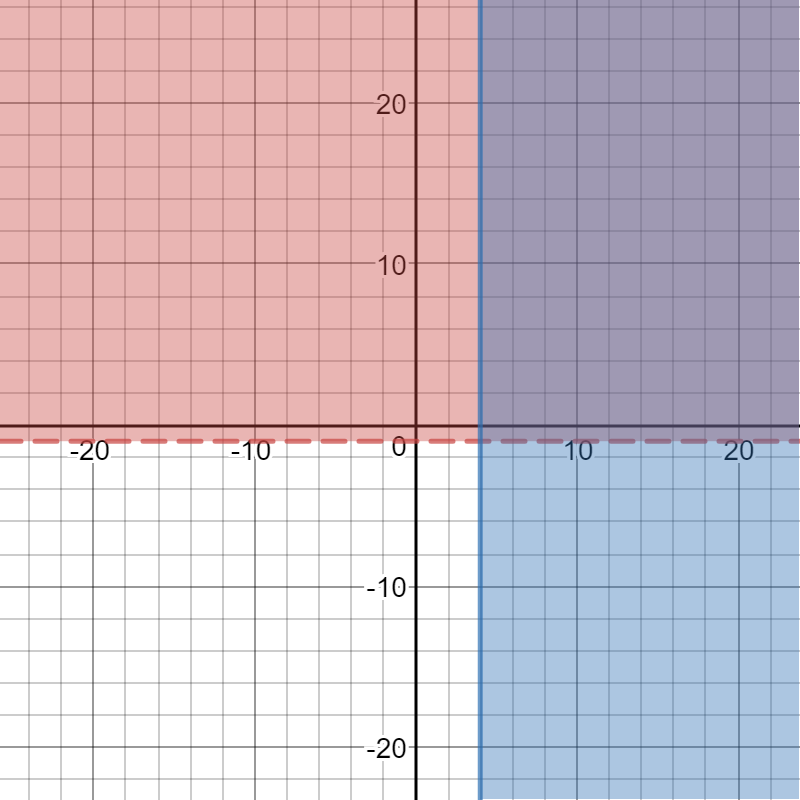
I'm not sure if this is what you are asking, but if you put these two together you get this, where the purple area is the solution:

enter image source here