How do you graph the inequality #y>= x+4# and #y >6x-3#?

1 Answer
Jul 23, 2017

When it is #>=#, make the line solid and shade in above the line. When it is just #>#, make the line dashed and shade in above the line.

Explanation:

Draw a solid line, #y = x + 4#, by placing a straight edge along the points #(0,4)# and #(-4,0)#:

www.desmos.com/calculator

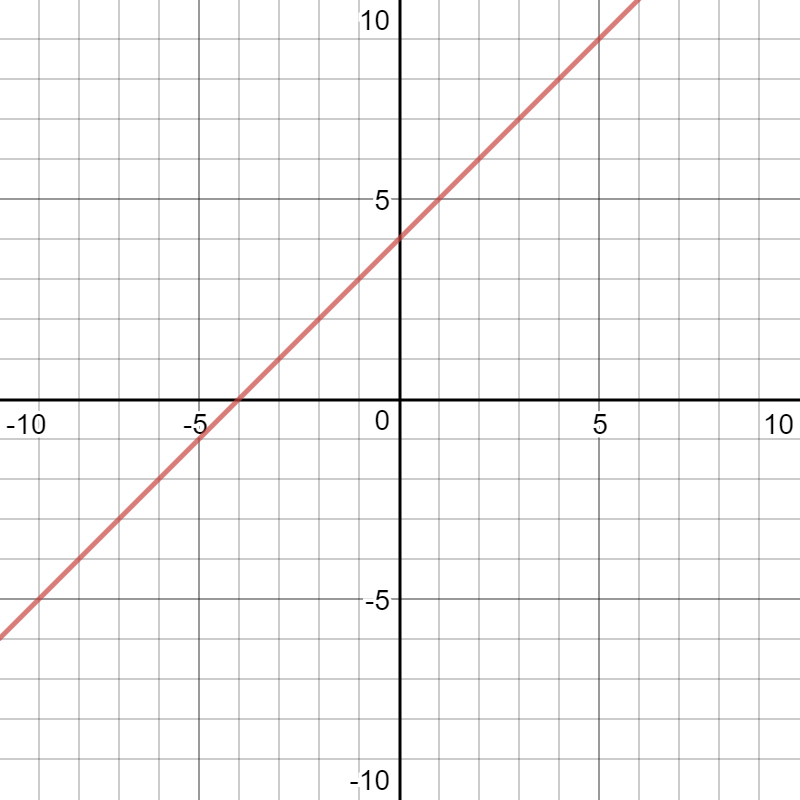
To obtain a graph of the
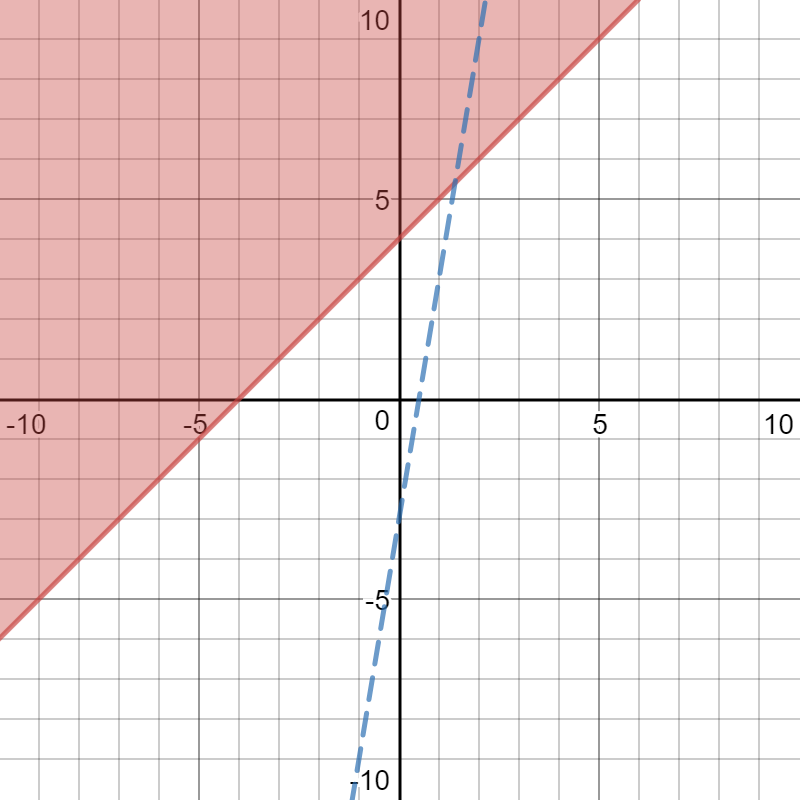
 #x >=x+4#, shade in the area above the line:

www.desmos.com/calculator

Draw a dashed line, #y = 6x -3#, by placing a straight edge along the points #(0,-3)# and #(1/2, 0)#:

www.desmos.com/calculator

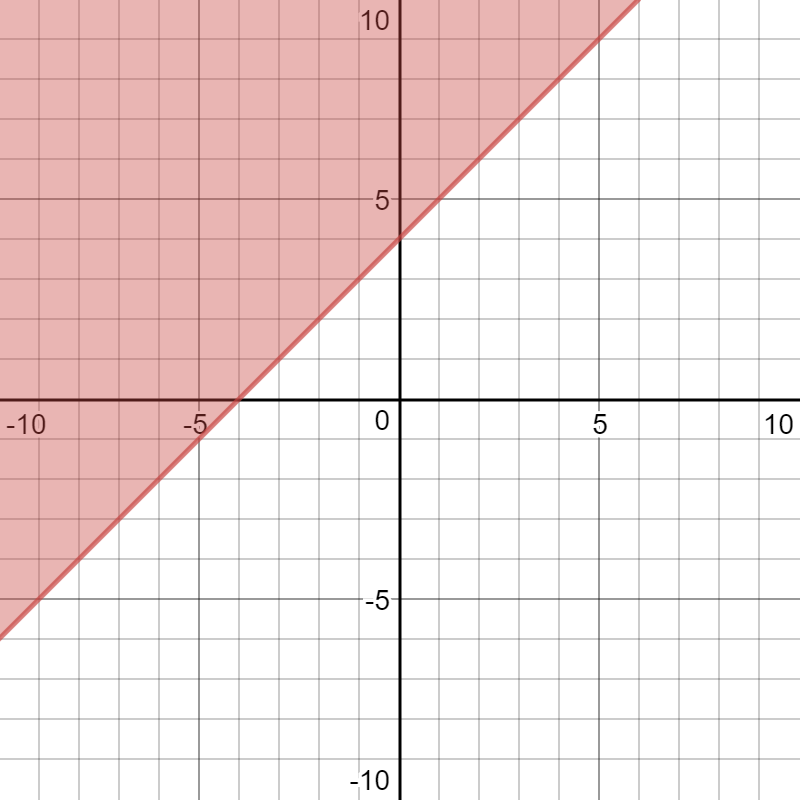
Shade in the area above the line:

www.desmos.com/calculator

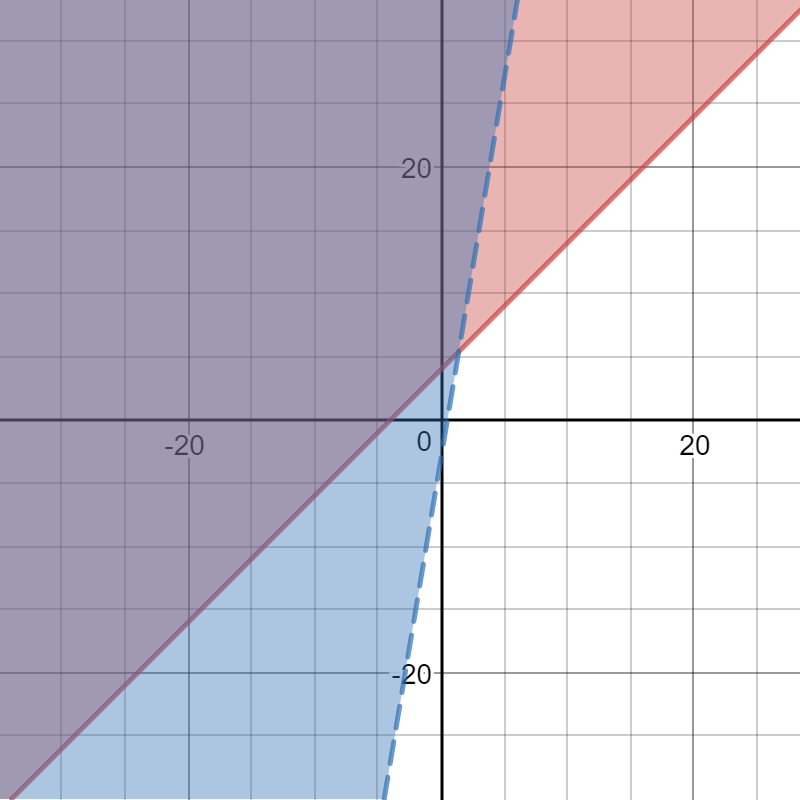
The magenta region is the region that makes both inequalities be true.