In Boyle's Law, when we plotted the graph between volume and pressure, why we put the volume in the x -axis and pressure on Y-axis? Thank you.
1 Answer

Aug 13, 2017
Technically, it can be either way...
Explanation:
If the volume is labeled for the
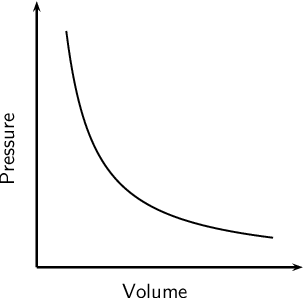
However, this graph would look exactly the same if pressure were the independent variable; i.e. we're changing the pressure to measure the volume:
It really all comes down to which variable you're changing and which one you're measuring. I think more often, pressure will be measured against volume, so volume would then be in the
