#color(blue)("Explaining what each part of the equation does.")#
#color(blue)("ie the transformation from basic form")#
This is transforming the graph of #y=x# which is the general shape of the sloping line type /
Using the absolute format #y=|x| # changes the general shape to V where the vertex ( point ) is at the x-axis. So for #ul("this case")#:
Vertex #->(x,y)=(0,0)# and y is always positive
Including the + 3 #->y=|x+3|# 'slides' the graph to the left by 3.
Adding 'slides' to the left whilst subtracting 'slides' it to the right.
Why is this? Consider the graph of #y=|x|#. Suppose we had the x-value of 0. Move to the right by 3. Draw a faint line upwards and note the point on the graph. Now plot a point at that y-value where#x=0#. You have 'shifted' to the left by 3.
The constant of -1 drops the whole thing by 1.
So for #y=|x+3|-1# the value if #y# can now be negative but no less than -1.
~~~~~~~~~~~~~~~~~~~~~~~~~~~~~~~~~~~~~~~~~~~~~~~~~~~~~
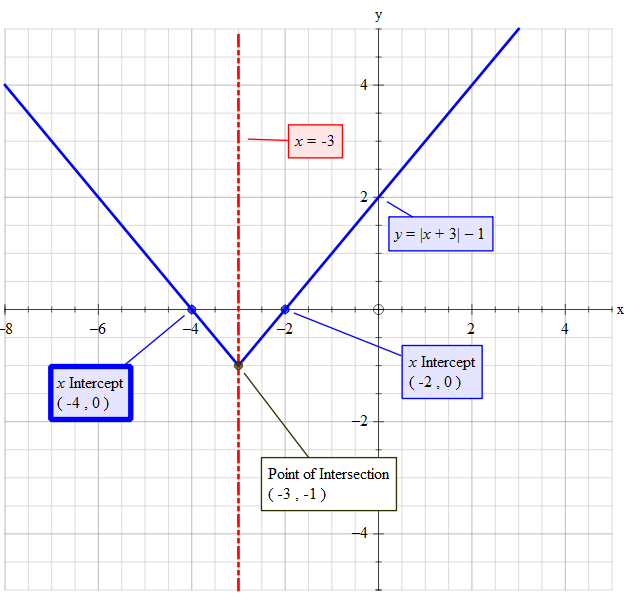
#color(blue)("Determine the vertex")#
Using the above explanation the Vertex #->(x,y)=(-3,-1)#
Or you cam calculate it by setting #y=-1#
#-1=x+3-1#
#x=-1-3+1=-3#
'......................................................................................
#color(blue)("Determine y-intercept")#
Set #x=0#
#y_("intercept") = |0+3|-1 = 2#
'.......................................................................................
#color(blue)("Determine x-intercept")#
Set #y=0#
#0=|x+3|-1#
Consider just one side of the V
Set #y=x+3-1" "->" "y=0=x+2#
In this case #x=-2#
Compare to the vertex #->(x,y)=(-3,-1)#
The point #x=-2# is to the right of #x=-3# by 1.
So the other point must be to the left of #x=-3# by 1 as well
Thus #x_("intercept") -> x=-4 and x=-2#