How do you graph the system of linear inequalities 4x>y and x<=12?
2 Answers

Sep 5, 2017
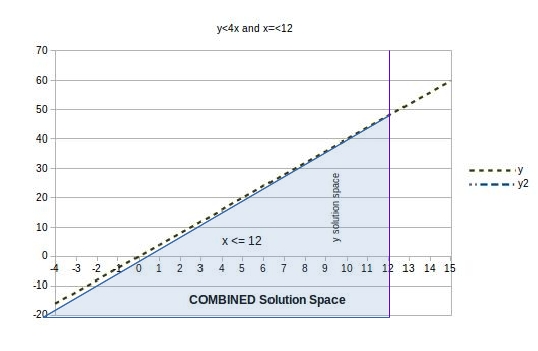
Plot the two lines using calculated values.
Explanation:
The first one should have a dotted line along the y = 4x line, as the exact solution is not included. Shade the area below the line. The second one is just a solid line at x = 12 and shading on the left side of it.
The intersection of the two solutions is the common overlapping shaded area.

Sep 5, 2017
graph{(4x-y)(12-x)^.5>0 [-156.6, 163.4, -91.5, 68.5]}
Explanation:
Draw the line
Take a random easy point such as
The take only the zone with
