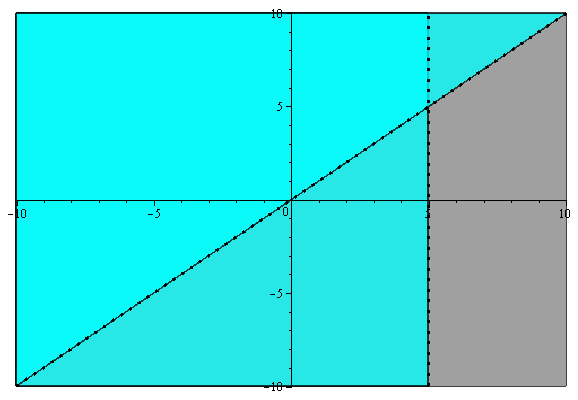
First plot the line #y=x#. This will give you one of the boundary lines. Remember to use a dashed line as this is a less than inequality and not a less than or equal to inequality.
Plot the line #x=5#. This will give you another boundary line. As before use a dashed line, because this is a greater than and not a greater than or equal to.
Test values on either side of each line to determine what region is shaded.
For #y < x#, if #x = 4#, #y < x# below the line #y=x#
For #x>5# , if #x=6#, to right of line #x=5#
To satisfy both conditions.
#x > 5# and #y < x#
if #x=6# and #y = 2#
This is the region below the line #y=x# and to the right of the line #x=5#. This is shown as the grey region on the graph.
Graph of #y < x , x > 5#:

This can seem a bit confusing. It is generally best practice in a case like this to plot the line of each inequality and determine the regions by examining the graph.


