How do you graph #3/2x+2/3y>1# on the coordinate plane?
1 Answer
(see below)
Explanation:
We can simplify the given inequality:
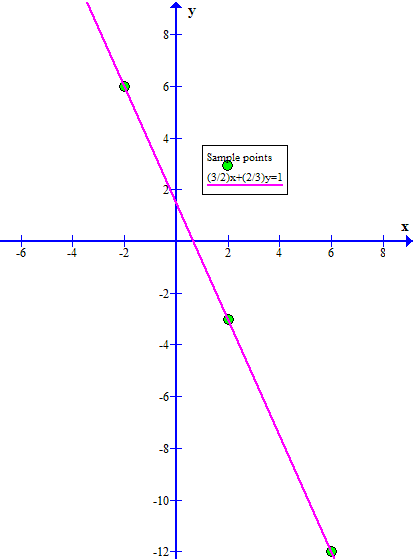
Next we need to determine the plot line for
and then determine which side of the line to shade in as
By testing a series of arbitrary integer values for
(I find it easier to plot with integer coordinates).
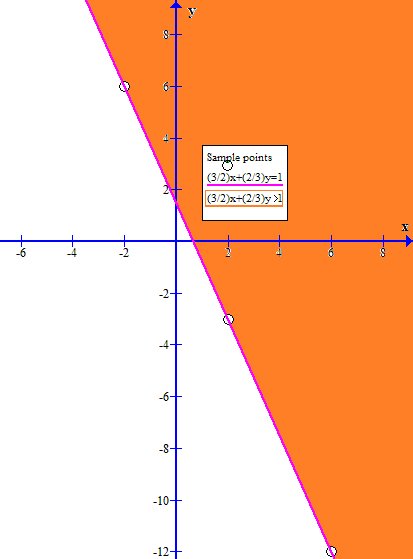
Plotting these coordinate pairs and drawing a line through them should give a graph like:
...BUT we only want the points for which
That is we only want the points on one side of this line.
We notice that
so the origin,
We need to shade the side that does not include the origin (and hollow out the circles on the equality line to show that it is not included):