How do you graph the inequality y > -2y>−2, x >5x>5?
1 Answer

Nov 5, 2017
Explanation:
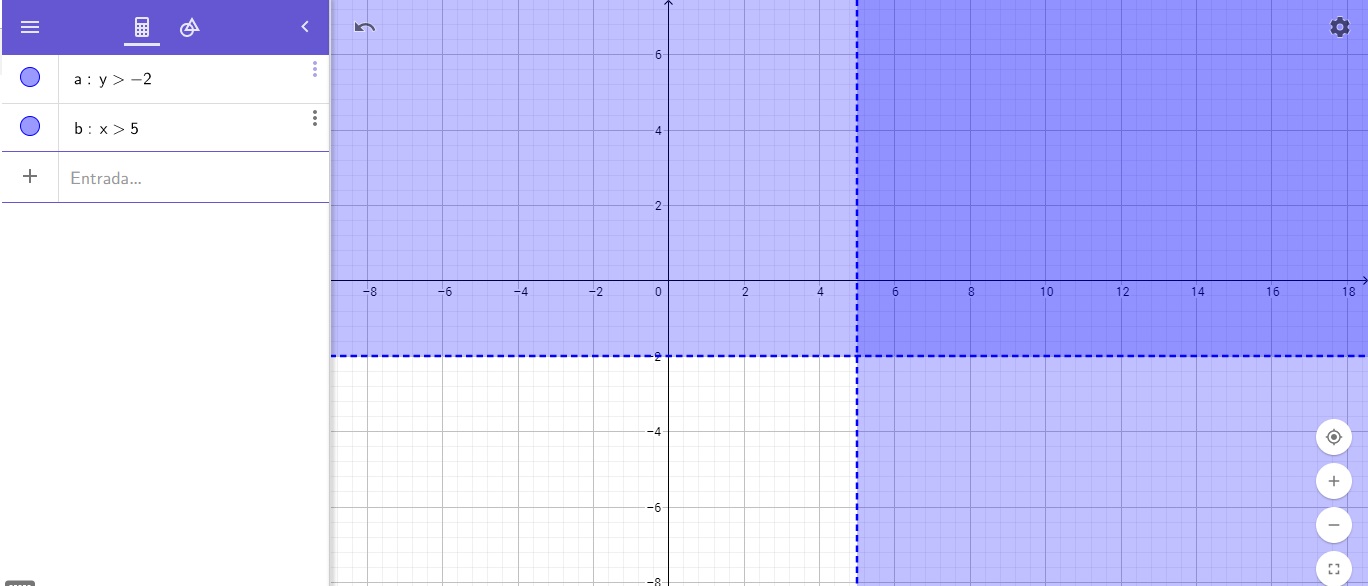
y=-2
it is the critical point
being an inequality with greater sign than, its graph is shaded upwards and a segmented line
same with
it is the critical point
being an inequality with a greater sign than, its graph is shaded to the right with a segmented line
