How do you graph #f(x)=4(3/4)^(x+1)-5# and state the domain and range?
1 Answer

Nov 8, 2017
See below.
Explanation:
The y axis intercept occurs where
There are no restrictions on
Domain is
For
as
So:
Range is:
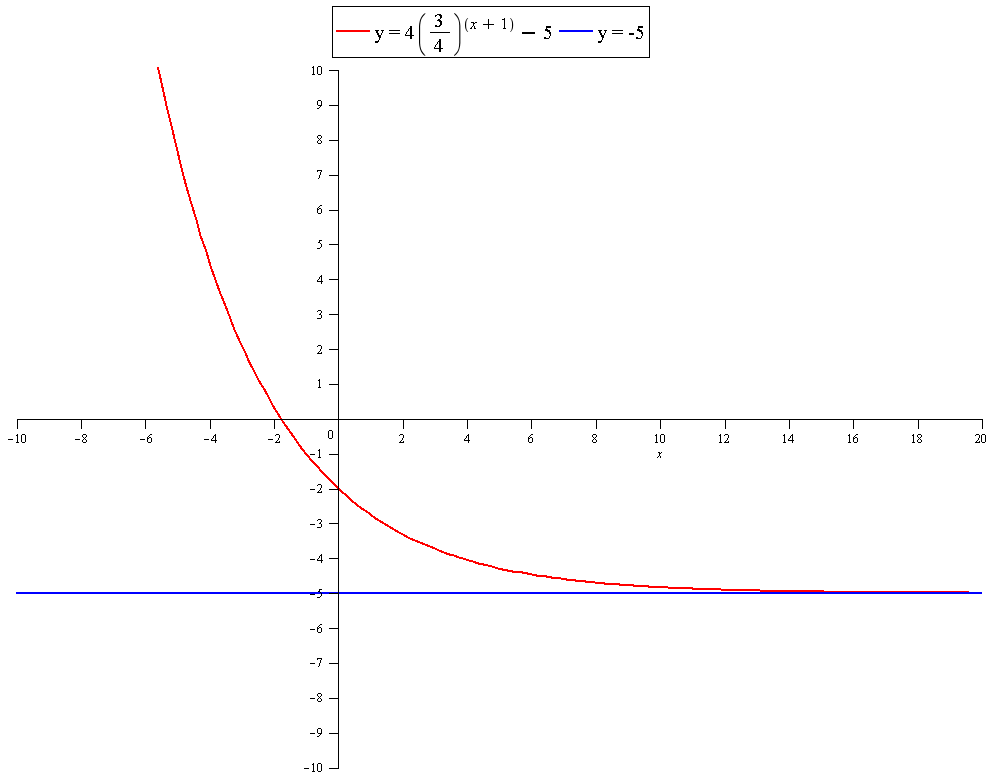
Graph: