Question #6e7f2
1 Answer

The slope is
Explanation:
STEP ONE: Reorganize the problem so
STEP ONE A: Subtract
STEP ONE B: Divide each side by
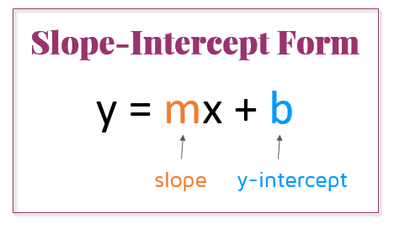
STEP TWO: Remember that when an equation is in slope-intercept form (the form
 Kate's Math Lessons
In this case, the
STEP THREE: To graph this equation, pick two easy numbers to substitute into the
I am going to choose
STEP THREE A: Substituting in
COORDINATE ONE:
STEP THREE B: Substituting in
COORDINATE TWO:
STEP FOUR: Graph the points on the grid
graph{y=-2x+70 [-37.1, 148.65, -11.95, 80.95]}
Hope that helped!
