How do you graph y=sqrt(x+1), compare it to the parent graph and what is the domain and range?
2 Answers

Domain:
Range:
Explanation:
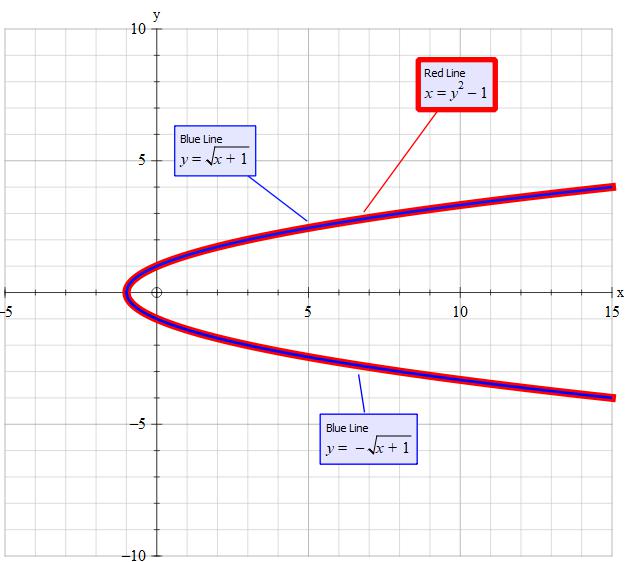
The parent graph is
The domain of the function is when the bit inside the square root is greater than or equal to zero (otherwise it wouldn't be defined in terms of real numbers). We can find out when this is the case by solving the following inequality:
So, our domain is
The range of the parent graph,

Quadratic of form
Symmetrical about the x-axis
Domain ('input for
Range ('output' for
Explanation:
This is a quadratic in
It is the same as the form
Square both sides
 Tony B
Consider the standardised form of
