How do you graph #y>abs(4x)#?
1 Answer
Jan 7, 2018
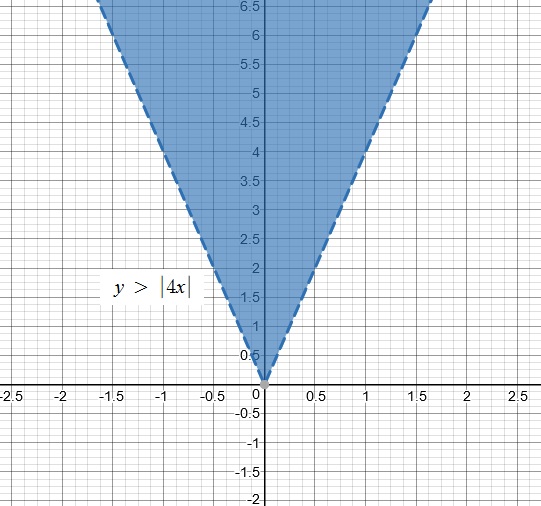
Inequality Graph is available with a brief explanation.
Explanation:
For the inequality
both the
Extreme Points of
Dashed Lines indicate that the value is NOT a part of the solution
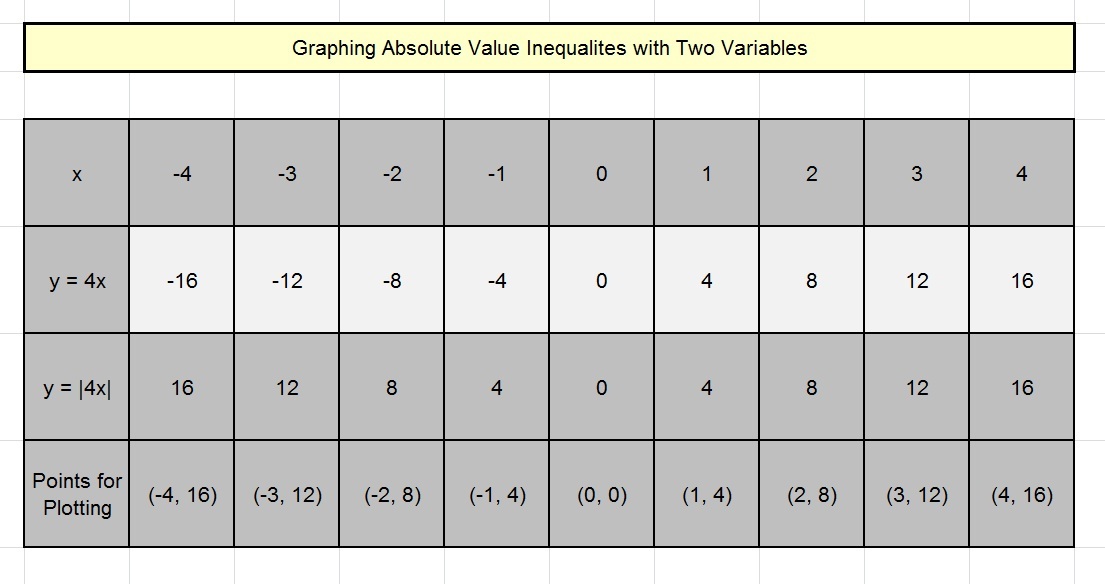
A Table may be created with

Every single
Please refer to the graph below for more information:


