How do you graph f(x)=2x^2-x+1 and identify the x intercepts, vertex?
1 Answer

See the explanation.
Explanation:
Given:
Our quadratic function is in Standard Form:
To find the Vertex, we can use the formula
Hence,
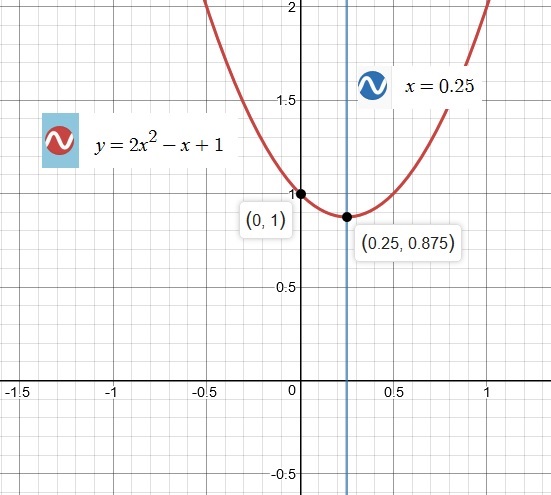
Vertex =
Vertex =
Vertex =
This is the x-coordinate value of our Vertex
To find the y-coordinate value of our Vertex,
substitute
Hence our Vertex can now be written as an Ordered Pair
Vertex =
To find the x-intercepts we set
Hence, we have
We will use the Quadratic Formula to solve for
Substitute the values in our formula:
Simplify to get
We observe that there are No Real Solutions
Hence, the function does not have x-intercepts.
Additional point of information:
What is the Axis of Symmetry?
The two sides of a graph on either side of the axis of symmetry look like mirror images of each other.
Next analyze the graph below to study the behavior of