What is a polar plot?
1 Answer
See below.
Explanation:
Consider a typical plot that you will have came across before:
The plot looks like this:
graph{x^2 [-2.47, 2.53, -0.36, 2.14]}
In this plot, every value along the
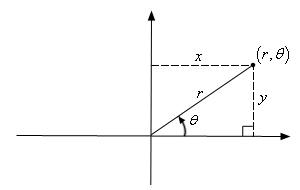
In polar coordinates we write the coordinates of a point in the form
The diagram below provides a simple illustration of how a point can be expressed in either Cartesian or polar coordinates.

From this we can also see how to convert between polar and Cartesian coordinates using simple trigonometry:
By Pythagoras theorem:
and also:
To convert back into Cartesian:
So a polar plot is quite simply plot where the function has been written in polar form, (i.e. a function that links
Whether or not you wish to use polar coordinates really depends on the situation. If the graph has some form of circular symmetry then perhaps polar may be advantageous over Cartesian.
Some examples of polar plots:

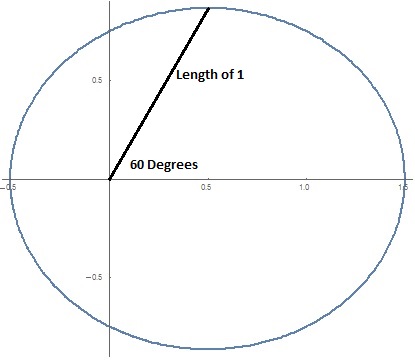
This is an ellipse with equation:
At an angle of
So a line drawn from the origin at 60 degrees from the
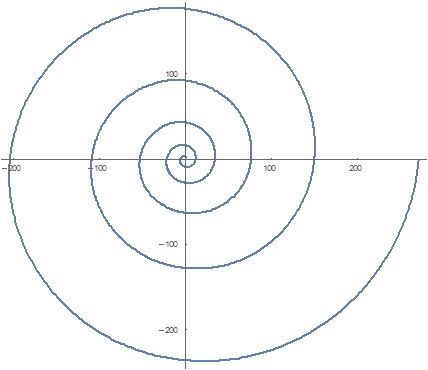
Polar plots can also be used to produce some interesting spirals as well,

This graph has equation:
As you can imagine this would be considerably difficult to work with in Cartesian.
But anyway, that is general idea of a polar plot.

