The Polar Coordinate System
Key Questions
-
Answer:
See below.
Explanation:
Consider a typical plot that you will have came across before:
#y=x^2# The plot looks like this:
graph{x^2 [-2.47, 2.53, -0.36, 2.14]}
In this plot, every value along the
#x# axis is linked to a point on the#y# axis. At#x=2# ,#y=4# . We write the coordinates as:#(2,4)# . When we write coordinates in the form#(x,y)# we call them Cartesian coordinates.In polar coordinates we write the coordinates of a point in the form
#(r,theta)# where#r# is the distance directly between the point and the origin and#theta# is the angle made between the positive#x# -axis and that line.The diagram below provides a simple illustration of how a point can be expressed in either Cartesian or polar coordinates.
From this we can also see how to convert between polar and Cartesian coordinates using simple trigonometry:
By Pythagoras theorem:
#r^2=x^2+y^2# and also:
#theta=tan^(-1)(y/x)# To convert back into Cartesian:
#x=rcostheta#
#y=rsintheta# So a polar plot is quite simply plot where the function has been written in polar form, (i.e. a function that links
#r# to#theta# as appose to a function that links#y# to#x# ).Whether or not you wish to use polar coordinates really depends on the situation. If the graph has some form of circular symmetry then perhaps polar may be advantageous over Cartesian.
Some examples of polar plots:
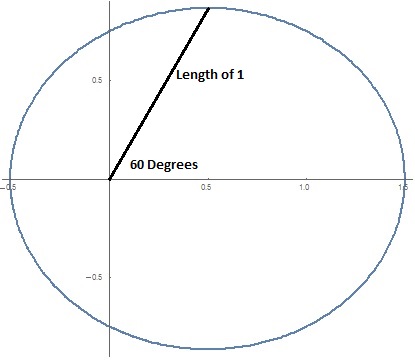
This is an ellipse with equation:
#r(theta) = 0.75/(1-0.5cos(theta)# At an angle of
#60^o# from the x-axis this would have a value:#r(60^o) = 0.75/(1-0.5cos(60^o))=1# So a line drawn from the origin at 60 degrees from the
#x# -axis will meet the ellipse when the length of that line is 1.Polar plots can also be used to produce some interesting spirals as well,
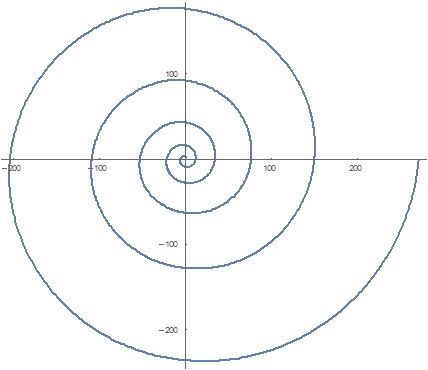
This graph has equation:
#r(theta)=e^sqrt(theta)# As you can imagine this would be considerably difficult to work with in Cartesian.
But anyway, that is general idea of a polar plot.
 Andrew I.
·
2
·
Jan 22 2018
Andrew I.
·
2
·
Jan 22 2018
-
Polar coordinates are used to analyse circular motion. In plane polar coordinates, equations of motion and results for circular motion become exceptionally simple and easy to work with.
 Aritra G.
·
1
·
Jul 23 2015
Aritra G.
·
1
·
Jul 23 2015
-
Polar coordinates are in the form
#(r,theta)# . This basically means (radius,angle). To graph them, you have to find your#r# on your polar axis and then rotate that point in a circular path by#theta# . The convention is that a positive#r# will take you r units to the right of the origin (just like finding a positive#x# value), and that#theta# is measured counterclockwise from the polar axis.#theta# is typically measured in radians, so you have to be familiar with radian angles to graph polar coordinates. However, it can be given in degrees. You can even convert between the two if you want to.Alternatively, you could convert polar coordinates to rectangular coordinates
#(x,y)# to graph the same point. To do this you can use the equations:#x=rcos(theta)#
#y=rsin(theta)# This is the relationship to show their equivalency:

Let's look at graphing
#(r,theta)# without converting it. This is what the "axes" system looks like for polar coordinates with a polar coordinate graphed: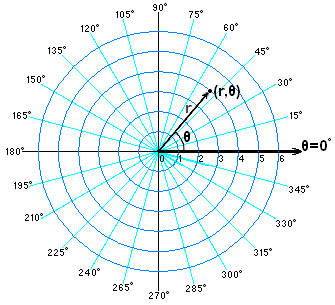
So, where
#theta=0# , you have the "pole" or "polar axis." You begin at the origin (the middle of the circles), and mark down the point that is your#r# (or radius). Here, it looks like#r=4# . Note: You have to start with#r# , and then from there rotate by#theta# . Now that you have your#r# , you need to rotate that point in a circular path until you reach the angle given. Here, it seems that#theta# is a little over#pi/4# . Sally
·
1
·
Mar 14 2015
Sally
·
1
·
Mar 14 2015