How do you graph the inequality #3-x>0# and #y+x< -6#?
1 Answer

See below.
Explanation:
First we write the inequalities as linear equations, and the graph these. Remember to use a dashed line, as these are not equal to inequalities, so the line itself will not be an included region.
We now graph these:
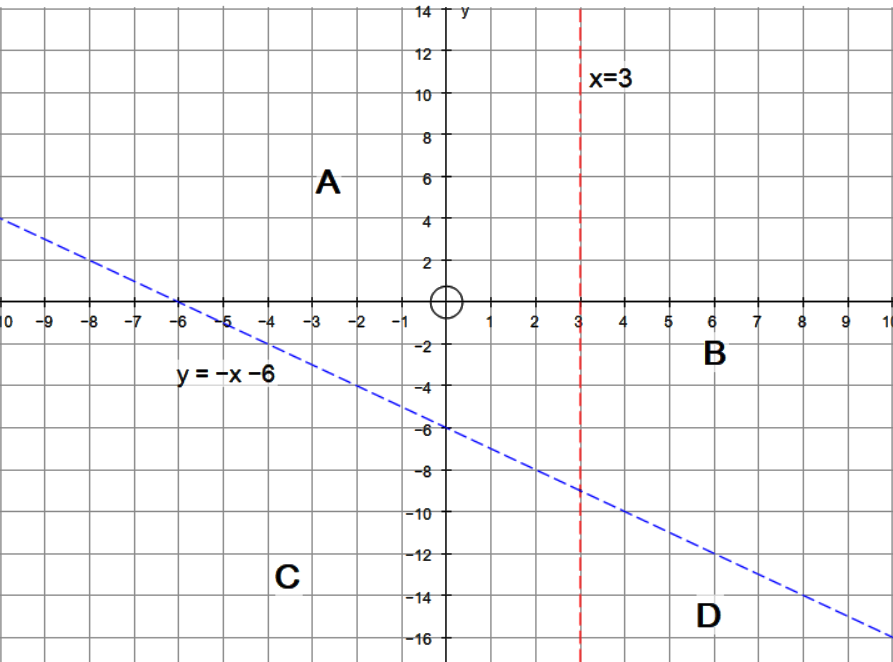
With graph plotted, we can see that there are four possible regions.
A , B , C and D
The required region has to satisfy both inequalities, so we test a set of coordinates in each region. We can save some work by realising that if a coordinate in a region fails for the first inequality we test, then the region can't be the required region and it is not necessary to test the other inequality as well.
Region A
Coordinates:
Region A is not the required region.
Region B
Coordinates:
Region B is not the required region.
Region C
Coordinates:
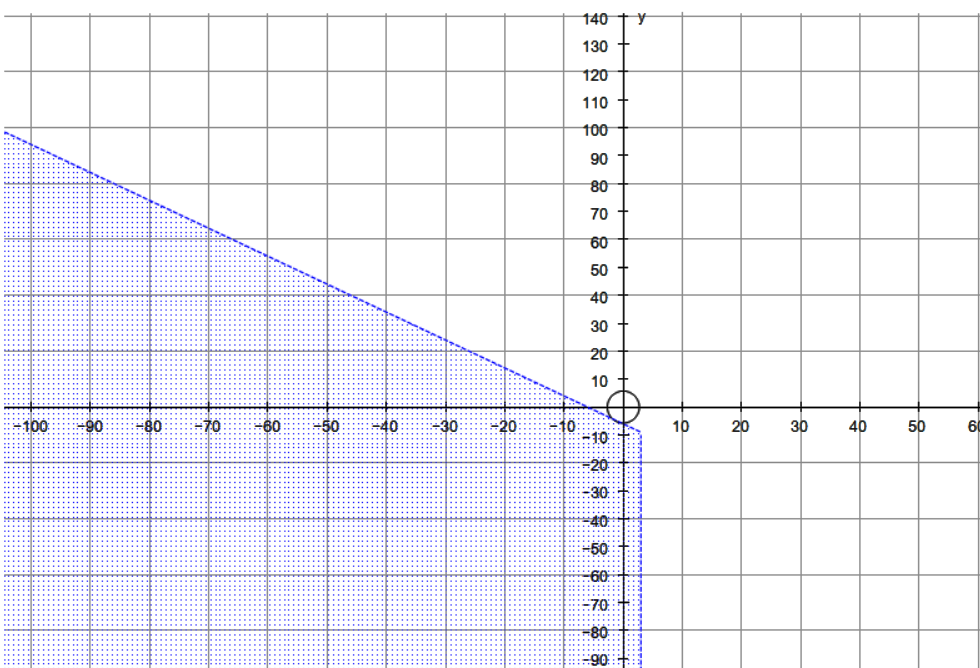
Region C is a required region.
We do not need to test region D. As can be seen from the graph above if C is an included region and is to the left of the line
Shade the required region C