How do you graph #y=-2^x#?
1 Answer

May 14, 2018
Create a data table to graph the exponential function :
Explanation:
Create a data table:
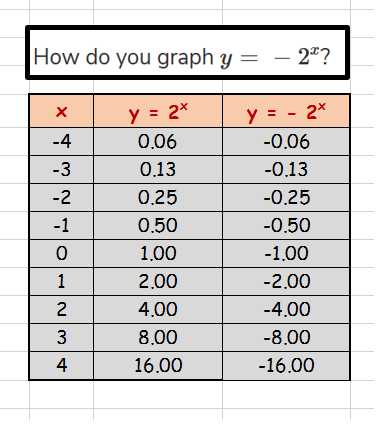
Closely examine the values for
No value of
So, the graph gets closer and closer to the x-axis but never touches the x-axis.
Hence,
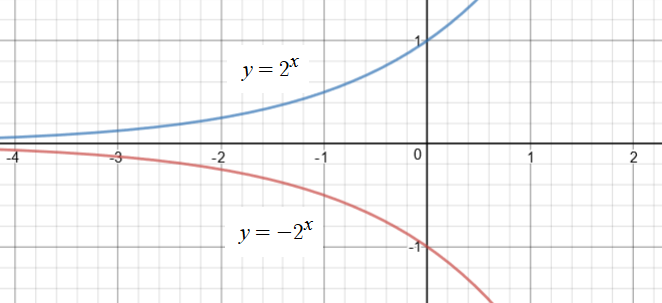
Using the data table, graph the function
For easy comprehension, graph the exponential function
Compare both the graphs to understand the behavior of the given exponential function
The graph of
