#color(blue)("Manipulating of the inequality")#
Manipulate this the same way you would an equation.
Add #color(red)(2y)# to both sides (changes it from negative to positive.
#color(green)(x-2y<=5 color(white)("dddd") ->color(white)("dddd") xcolor(white)("d") ubrace(-2ycolor(red)(+2y))<=5 color(red)(+2y)#
#color(white)("dddddddddddddddddddddddd") darr#
#color(green)(color(white)("dddddddd.ddd.") ->color(white)("dddd")xcolor(white)("..d") +0 color(white)("ddd") <= 5+2y)#
Shortcut method: move it to the other side and change the sign from subtract to add
Subtract 5 from both sides
# color(green)(color(white)("dddddddddddddd")->color(white)("dddd") x-5 <=2y)#
Divide both sides by #color(red)(2)#
#color(green)(x-5 <=2y color(white)("dddddd") ->color(white)("dddd")1/color(red)(2) x-5/color(red)(2) <= 2/color(red)(2) y#
#color(green)(color(white)("ddddddddddddddd")->color(white)("dddd")1/2x-5/2 <=y)#
Shortcut method: move the 2 from #2y# to the other side and change it from multiply to divide (everything)
Writing this in line with convention:
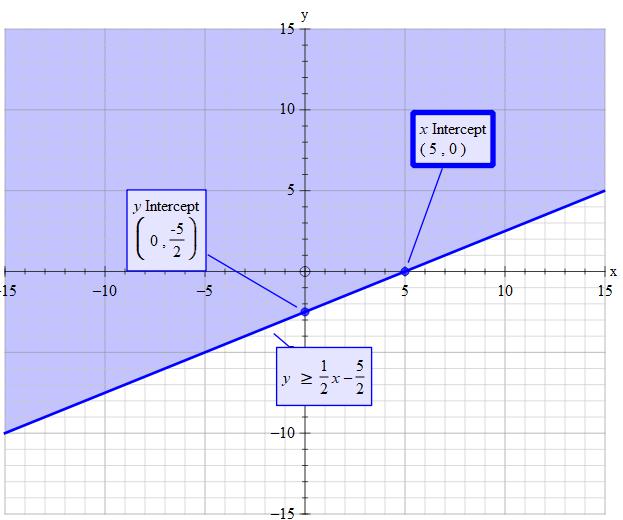
#y>=1/2x-5/2#
Think of the > as a birds beak. Notice that the wide part of the beak faces the y no matter which side of the inequality it is.
~~~~~~~~~~~~~~~~~~~~~~~~~~~~~~~~~~~~~~~~~
#color(blue)("Plotting the inequality")#
#ul("As the symbol is ">=" the the line plotted is solid.")#
Note: If the symbol was #># the line would be dotted
Gust so that you 'get the line' think of the inequality as
#y=1/2x-5/2#
Set #y=0=1/2x-5/2color(white)("dddd") =>color(white)("dddd") x=5#
#color(brown)("So the x-intercept is 5")#
Set #x=0 ->y=0-5/2#
#color(brown)("So the y-intercept is "-5/2)#
The inequality states #y>=" something"# so the feasible region is all the area above and on the line. (y is greater than or equal to)
#color(brown)("feasible region is all the area above and on the line")#