How do you graph the line #y = 4#?
2 Answers


Jun 30, 2018
See below.
Explanation:
When graphing

Jun 30, 2018
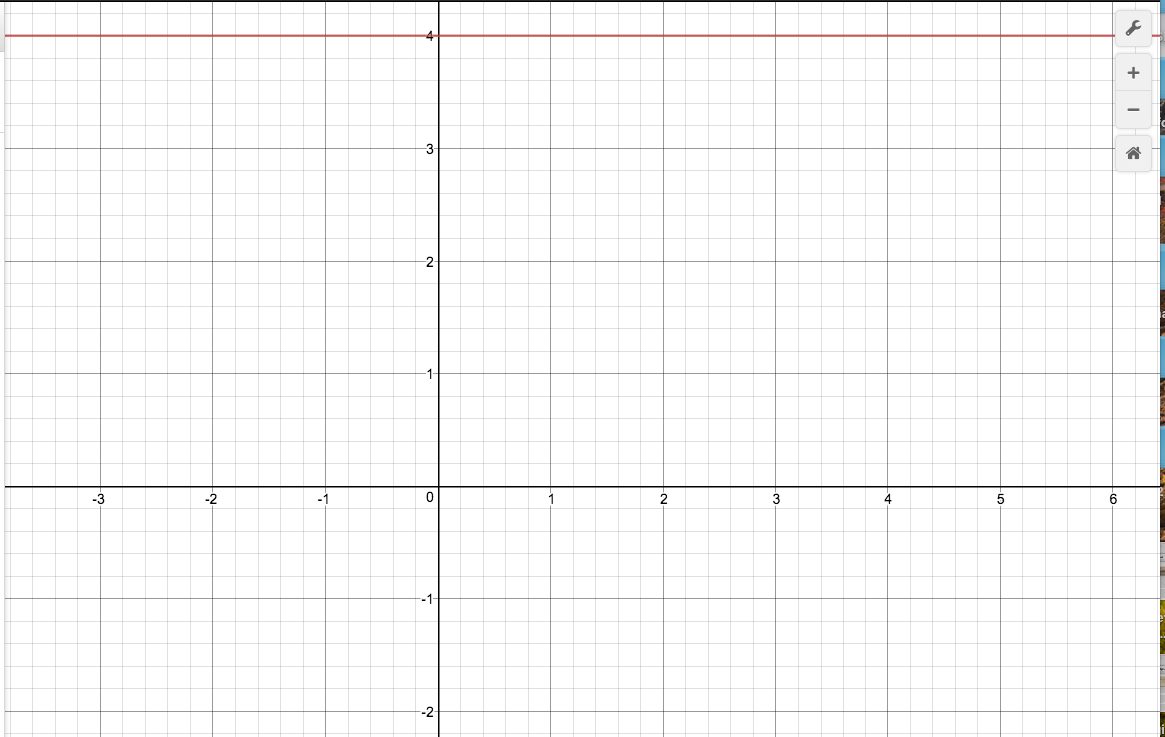
Horizontal line at
Explanation:
In slope-intercept form, this equation can be written as
The only kind of line with a slope of zero is a horizontal line- the only values this equation takes on is when
We will just have a horizontal line at
graph{y=0x+4 [-9.96, 10.04, -3.08, 6.92]}
Hope this helps!
