How do you graph #f(x)=x^2-x+5/4# and identify the x intercepts, vertex?
1 Answer

Jul 8, 2018
Vertex:
x-intercept: None.
Explanation:
We are given the Quadratic equation:
To draw a graph, create a table of values using the given quadratic function
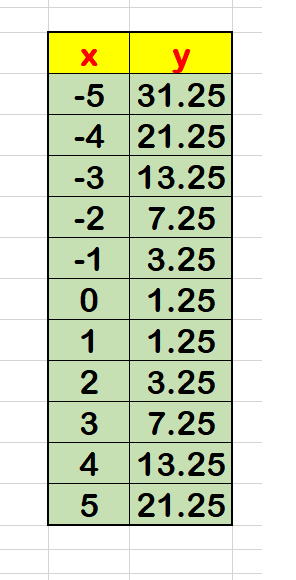
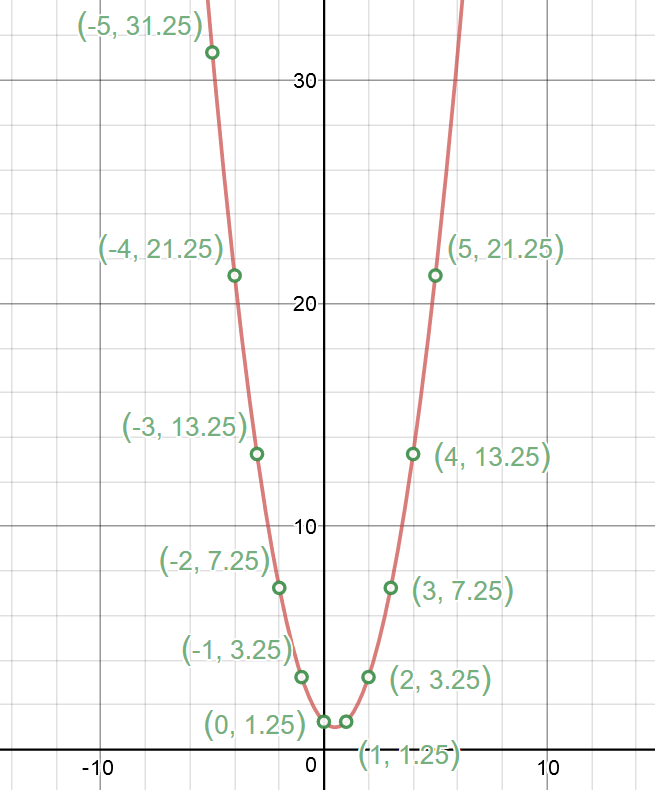
Using this table, plot the points and draw the graph:
Since the coefficient of the
Minimum Point is the Vertex of the Parabola:
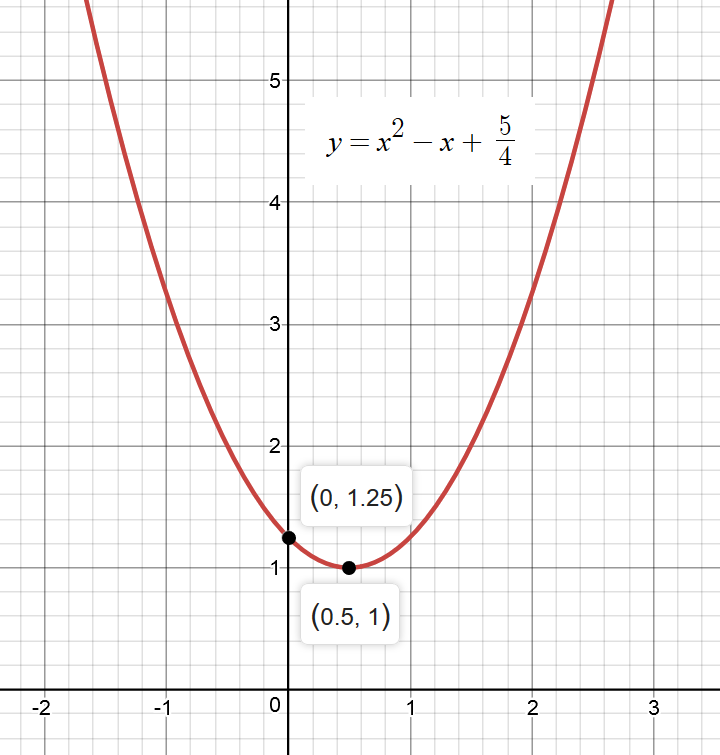
From the graph, it is obvious that Vertex (Minimum point) is at:
Since the parabola does not intersect the x-axis, the graph does not have an x-intercept.
The parabola passes through the y-axis.
So, y-intercept: :
