How do you use the important points to sketch the graph of #y=2x^2+6 #?
1 Answer

Please read the explanation.
Explanation:
We are given the quadratic equation:
General form:
Note that :
The coefficient of the
Set
Hence, y-intecept:
Set
Hence, there are no x-intercepts.
To find the vertex of the parabola:
Hence, the x-coordinate of the Vertex is = 0
To find the y-coordinate of the Vertex, set x = 0
Hence,
Axis of Symmetry :
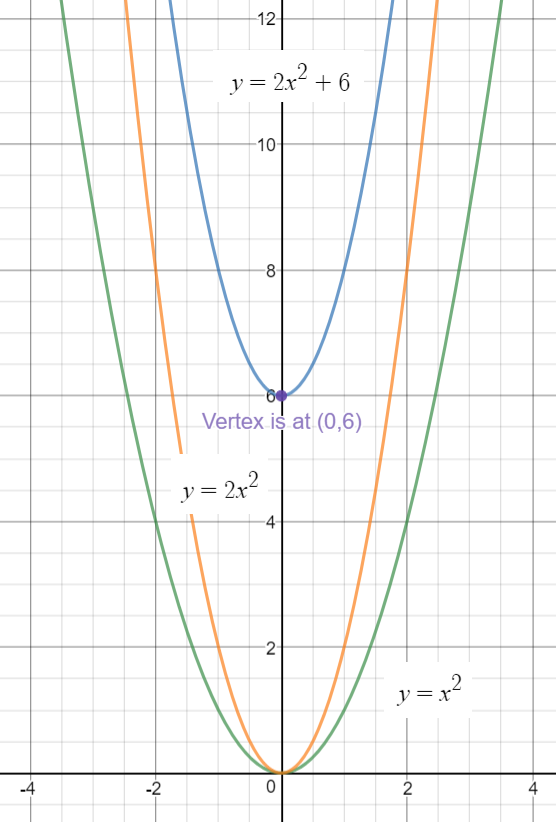
Graphs of
Graph of
Using the above intermediate results, we can graph:
For the sake of better understanding, graphs of:
Better understanding is achieved, by comparing the behavior of all the three graphs.
Hope this helps.
