How do you graph #y= |x+1|#?

1 Answer
Jul 26, 2018

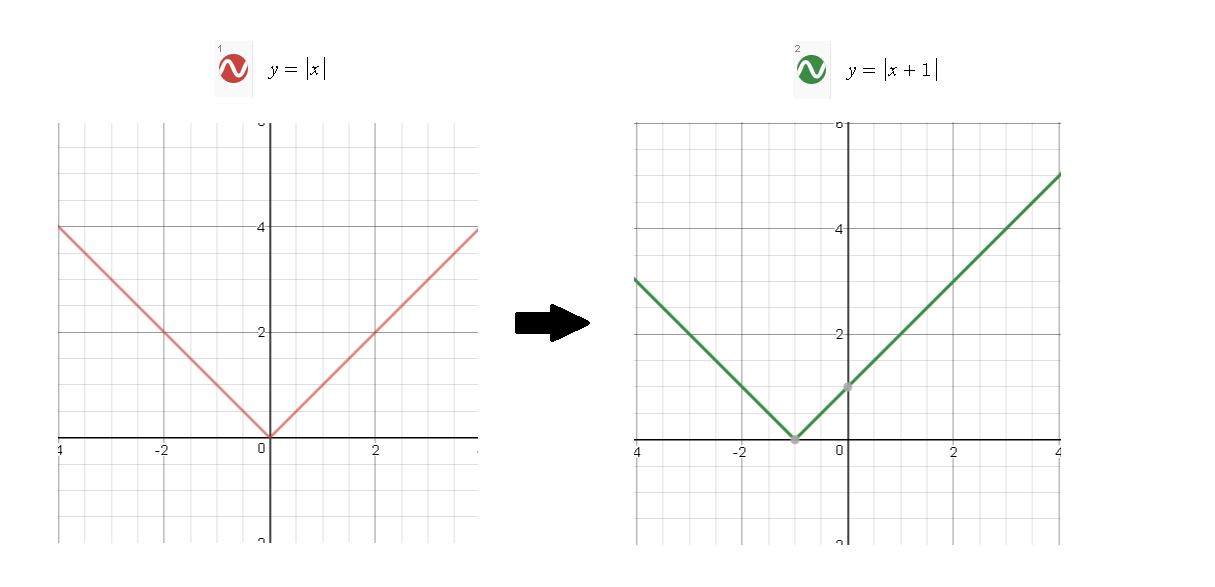
graph{y=|x+1| [-8.08, 7.68, -1.54, 6.336]}
Shift #y=|x|#
or
Sketch two linear functions (lines)

Explanation:

The easiest way to do this is to just shift the graph of #y=|x|# one unit to the left.

We can see this a lot more clearly if we set #f(x) = |x|#, so #f(x+1)=|x+1|#, indicating a one unit shift to the left.

enter image source here

An alternative way of graphing #y=|x+1|# is to think of it as two linear functions. The function depends on whether #x+1# is negative or positive.

We know when #x >= -1#, #y = x+1#

and when #x < -1#, #y = -x-1#

We can rewrite this as a piecewise function:

#f(x) = { (x>= -1 ", " x+1), (x<-1 ", " -x-1) :}#

We essentially sketch the graph of #y=x+1# on the right of #x=-1#

and we sketch the graph of #y=-x-1# on the left of #x=-1#.