Using Microsoft Excel to Analyze Data Using Linear Regression
Key Questions
-
I assume you mean this:

The "Coefficients" are the slope or y-intercept in this case. "HH SIZE" refers to the Slope, and of course, Intercept is the y-intercept.
If you multiply the Standard Error by
#1.96# , you get the Associated Error for either the Intercept or the Slope. The Associated Error is basically the uncertainty you have.For example, in a standard physics lab course, bare minimum, here's what you would need to know:
- Slope
- Intercept
- Slope Standard Error (
#SE_"slope"# ) - Slope Associated Error (
#AE_"slope"# ) - Intercept Standard Error (
#SE_"int"# ) - Intercept Associated Error (
#AE_"int"# )
The sample standard deviation is:
#s = sqrt(1/(N-1) sum_(i=1)^N (x_i - barx)^2)# where
#N# is the number of trials,#x_i# is each individual value, and#barx# is the average of said values.The Standard Error is:
#SE = s/sqrt(N)# where
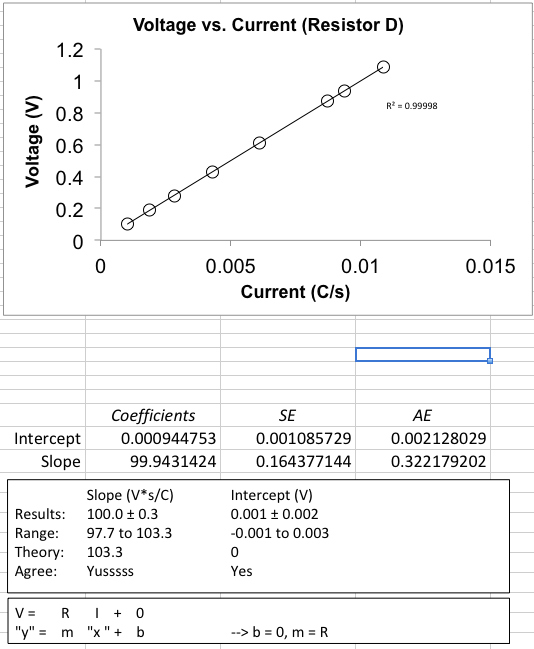
#s# is the standard deviation above, and:#AE = 1.96*SE# Here is an example of an Ohm's law analysis I did using a similar regression statistics table:

Oftentimes, even in a quantitative analysis course, you only need to further know the coefficient of determination
#R^2# . The closer it is to#1# , the better it is, but it is only for a linear fit line.Other than that, I have not had to use any other quantity on the regression statistics table in my 7 University semesters.
-
I've posted a video that will help with this topic. It is a screencast that will show you how to enter your data, add the trendline (line of best fit) and add the equation for the line so that you can complete the data analysis.
Hope this helps.