How do I graph the quadratic equation #y=x^2+4x+6#?
1 Answer

You have a quadratic function in the form
You can start by observing that the coefficient of the
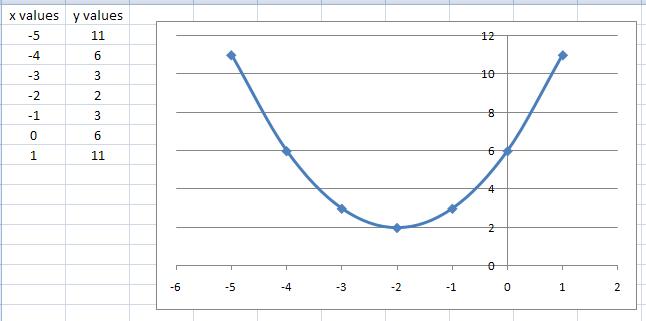
Then you need to determine 3 sets of coordinates that characterize your parabola:
1) The Vertex: this is the lowest point of your parabola (the bottom of your U).
to find its coordinates (
Where
2) Crossing point with the
This point has coordinates: (
3) Crossing point(s) with the
These are obtained putting
If the equation doesn't have solutions (
If
In our case we have:
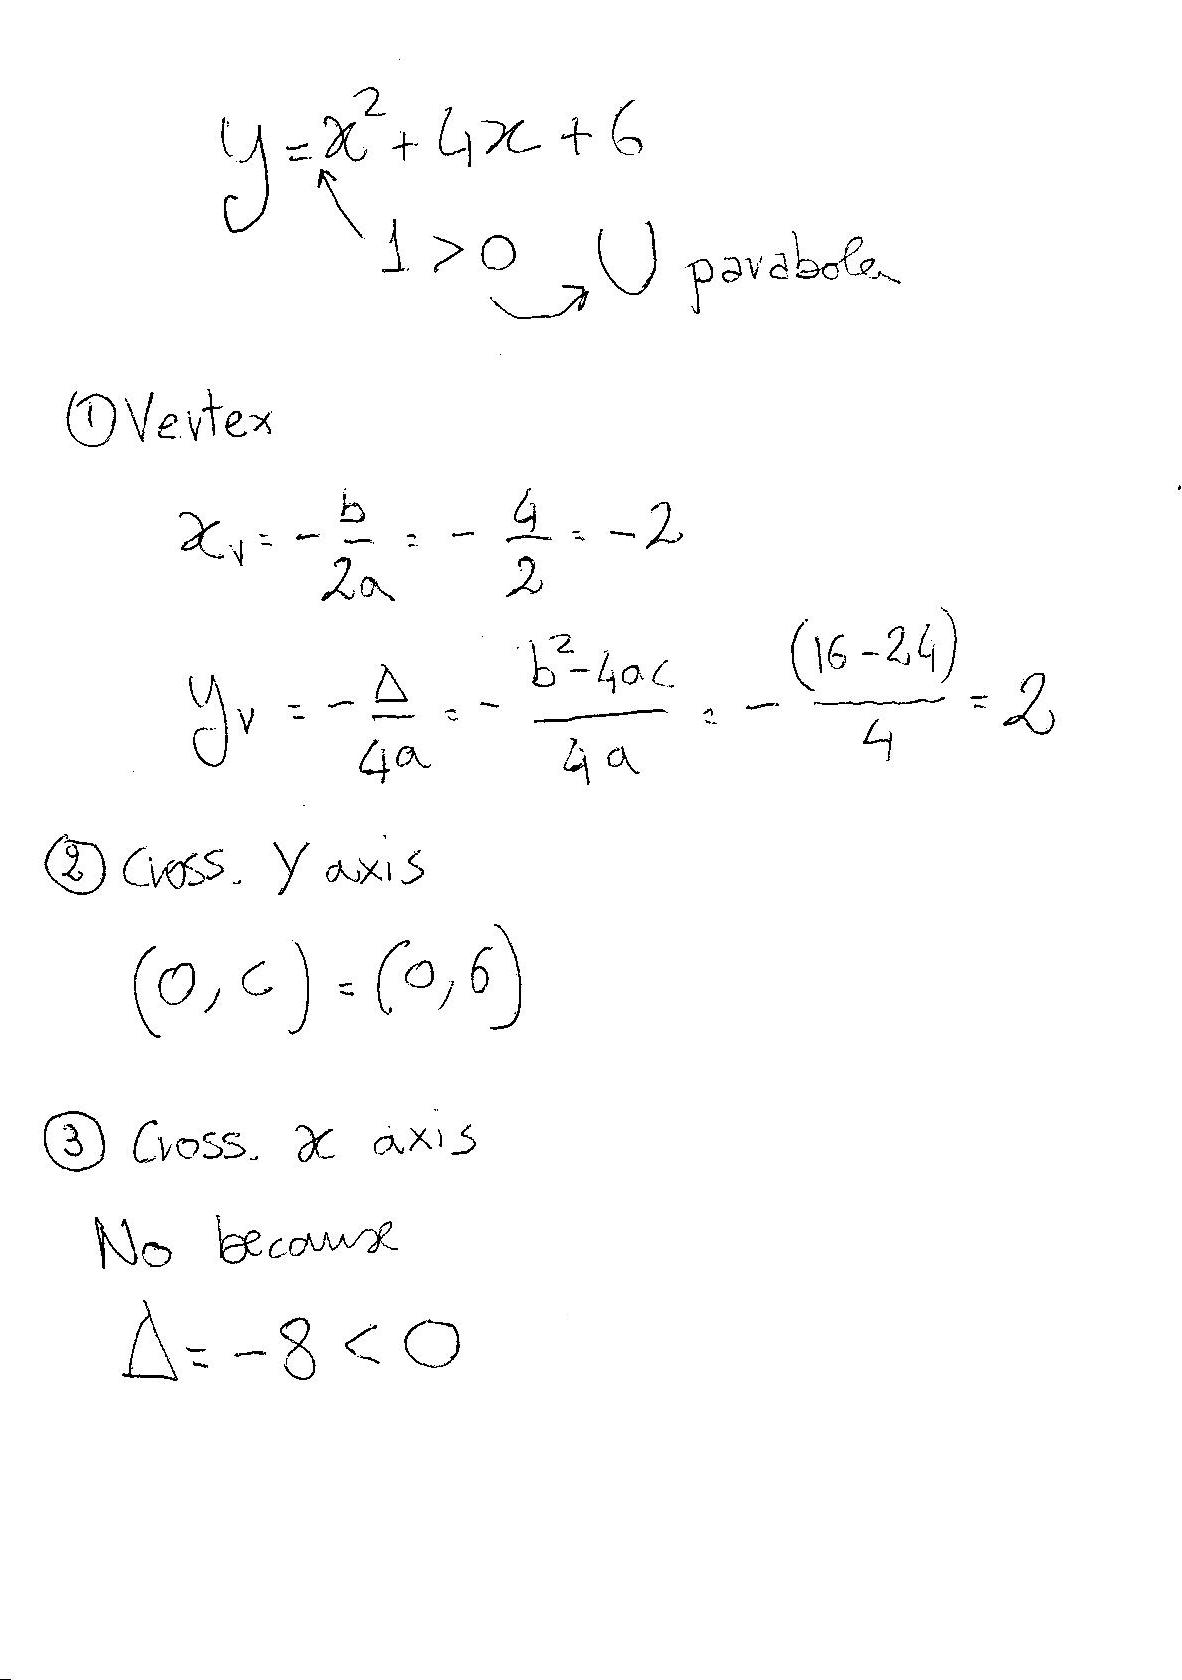
and: