How do you graph #f(x)=3^(x - 2)#?

1 Answer
May 4, 2018

#" "#
Please read the explanation.

Explanation:

#" "#
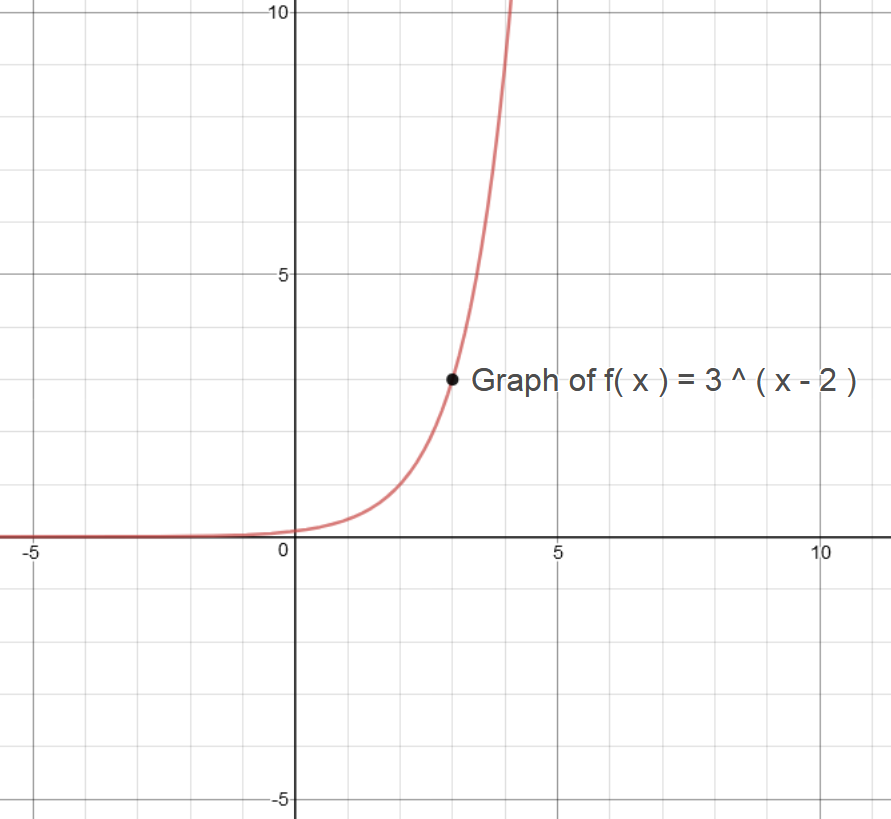
Given the exponential function: #color(red)(f(x)=3^(x-2)#

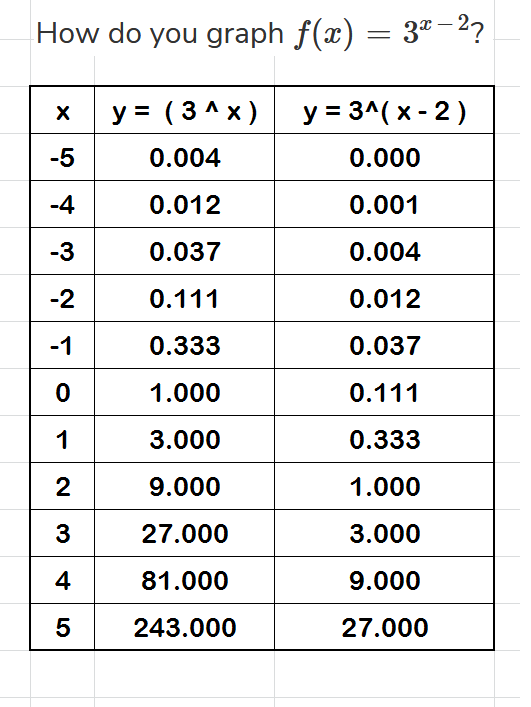
Before graphing this function, create a data table:

The table should contain values for #color(red)(x#, corresponding values for #color(red)(y=3^x) and color(red)(y=3^(x-2)#

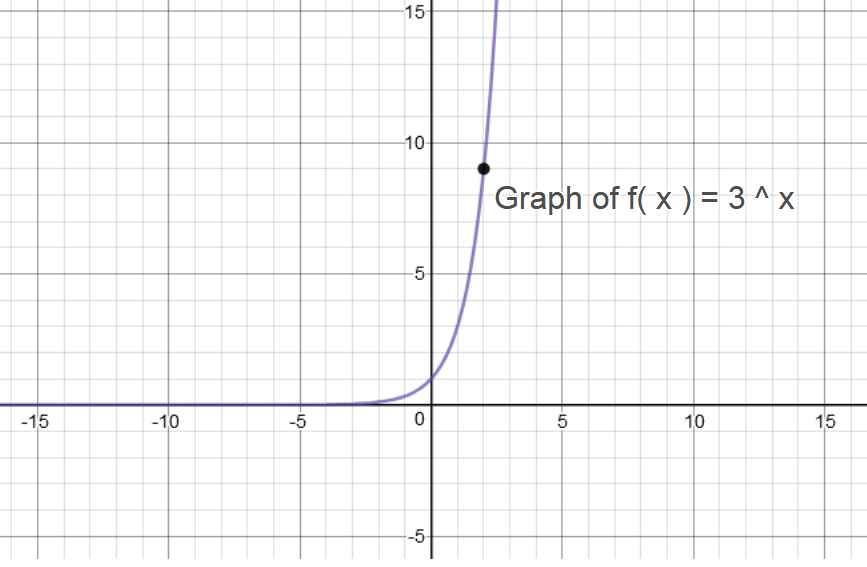
We include the base function: #color(red)(y=3^x#, since it provides an opportunity to examine the behavior of both the graphs by comparing them.

The table shows #color(red)x# and the corresponding #color(red)(y# values:

enter image source here

Construct both the graphs:

#color(green)"Graph 1:"#

#color(blue)("Graph of "y = f(x) = 3^x#

enter image source here

Domain : #(-oo, oo)#

Range : #(0, oo)#

y-intercept : #(0,1)#

Horizontal Asymptote :#y=0#

#color(green)"Graph 2:"#

#color(blue)("Graph of "y = f(x) = 3^(x-2#

enter image source here

Domain : #(-oo, oo)#

Range : #(0, oo)#

y-intercept : #(0,1/0)#

Horizontal Asymptote :#y=0#

#color(green)"Graph 3:"#

#color(blue)("Graph of "y = f(x) = 3^(x) and y = f(x) = 3^(x-2)#

Compare the behavior of both graphs:

enter image source here

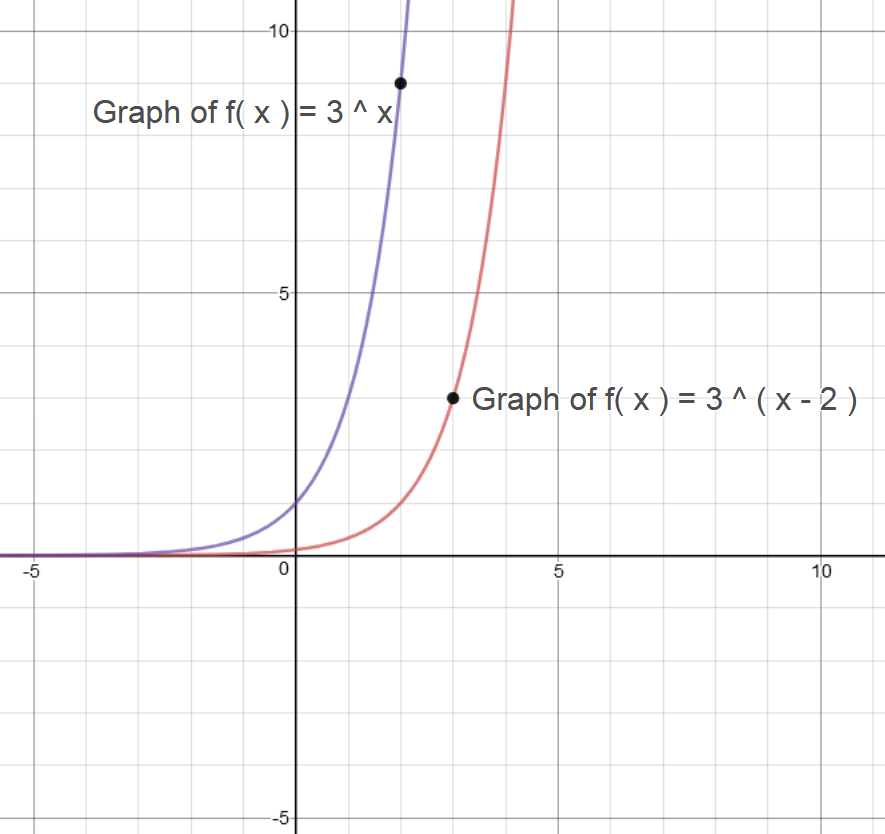
Translation is horizontal for #y = f(x) = 3^(x-2)# by #color(red)(2# units.

Hope it helps.