f(x)=log_(1/3) (x+5)f(x)=log13(x+5)
The vertical asymptote is found by setting x+5x+5 equal to zero.
x+5=0 => x=-5x+5=0⇒x=−5
The base of the log is 1/313. A base that is less than one indicates that the graph is a decreasing log.
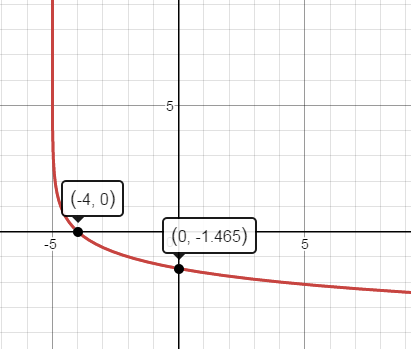
To find the xx intercept, set f(x)=0f(x)=0
0=log_(1/3) (x+5)0=log13(x+5)
Rewrite as an exponential and solve.
(1/3) ^0 = x +5(13)0=x+5
1=x+51=x+5
x=-4x=−4 when f(x)=0 =>f(x)=0⇒ the xx intercept is (-4,0)(−4,0)
The yy intercept is found by setting x=0x=0
y=log_(1/3) (0+5)y=log13(0+5)
y=log_(1/3) 5y=log135
Use the change of base formula log_a b = logb/logalogab=logbloga
y=log5/(log (1/3))=-1.46 =>y=log5log(13)=−1.46⇒the yy intercept is (0, -1.46)(0,−1.46)
See the graph below.
 desmos.com
Alternatively, the function can be rewritten as an exponential and an xyxy table can be constructed by choosing values of yy and finding corresponding xx values.
y=log_(1/3) (x+5)y=log13(x+5)
x+5 = (1/3)^yx+5=(13)y
x=(1/3)^y -5x=(13)y−5
Then choose values of yy such as -2,-1,0,1,2−2,−1,0,1,2 and find the corresponding values of xx. Plot the resulting xyxy coordinates.
desmos.com

