How do you graph the inequality #2x - 3y>9# and #- x - 4y> 8#?
2 Answers
Solution set of a system of 2 linear function
Explanation:
Bring the 2 inequalities to standard form:
2x - 3y - 9 > 0 (1)
-x - 4y - 8 > 0 (2).
First graph the 2 lines
Graph Line y1 = 2x - 3y - 9 = 0 by its 2 intercepts.
Make x = 0 --> y = -3.
Make y = 0 -->
the solution set of inequality (1) is the area above the Line y1.
Graph Line y2 = -x - 4y - 8 = 0 by its 2 intercepts.
Make x = 0 --> y = -2
Make y = 0 --> x = -8
To find the solution set, check the position of the origin (0, 0).
Replace x = 0 and y = 0 into the inequality (1), we get -9 > 0. That is not true. Consequently, the solution set of inequality (1) is the area below the Line y1.
Replace x = 0 and y = 0 into inequality (2) --> -8 > 0. Not true. Then, the solution set is the area below the Line 2.
The solution set of the system is the commonly shared area.
graph{2x - 3y - 9 = 0 [-10, 10, -5, 5]}
graph{-x -4y - 8 = 0 [-10, 10, -5, 5]}

See below
Explanation:
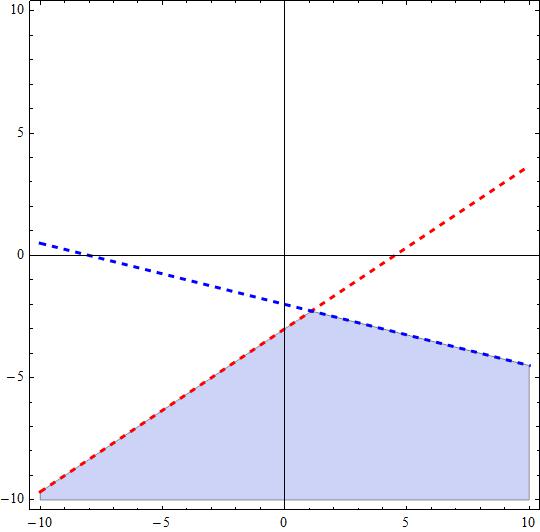
Given the inequalities, plot them as equalities, resulting two lines.
Determine the semi-plane which obeys the inequality. This is done easily at the
For the first inequality we have
For the second inequality we have
The feasible region, in the attached figure, satisfying both inequalities, appears in light blue.
A short notation for this region is