How do you graph the inequality #y≥2x# and #y ≤-x+2#?
1 Answer

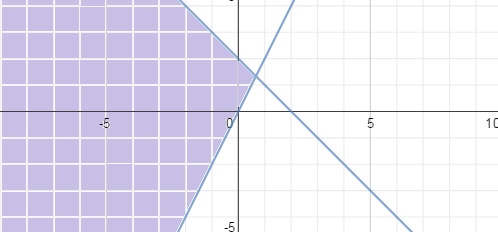
Draw a solid line for the lones of the two equations, and shade under the area of the graph for the equation
Explanation:
Not much of an explanation here, but draw two graph.
On one graph draw a solid line, not dashed, of gradient 2, rhe goes through the origin, and label it
On your secnd graph, draw a solid line of gradient -1, and a y-intercept of 2 and label it
Graphs for reference:
graph{2x [-10, 10, -5, 5]}
graph{-x+2 [-10, 10, -5, 5]}
and solution is given by all points in the shaded region, as it satisfies both the inequalities. The points on the lines are also included.