How do you graph the system of linear inequalities #y> -1#, #x>=-1# and #y>=-x+1#?

1 Answer
Nov 7, 2016

Graph each inequality as if it were an equation, using a solid or dotted lines, and the shade.

Explanation:

Graph the system of inequalities.

#color(red)(y> -1)#, #color(purple)(x>=-1)#, and #color(green)(y>=-x+1)#

Graph all the inequalities as if they were equations, using solid or dotted lines as appropriate, then add shading as detailed below.
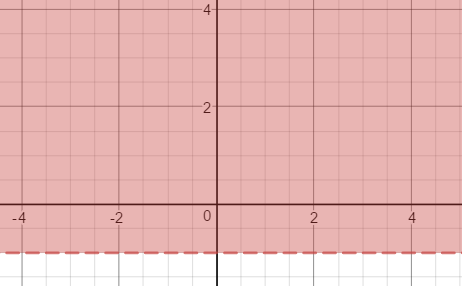
The graph of #y= -1# is a horizontal line through the #y# axis.
To graph the inequality, draw a dotted line (
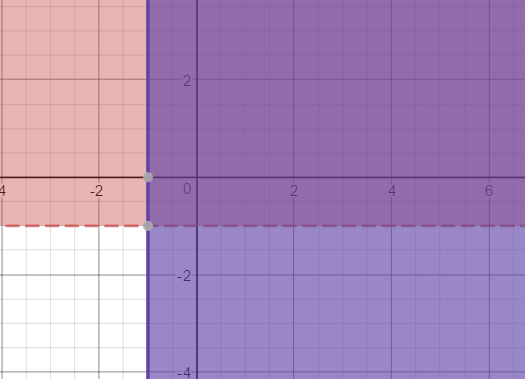
#># indicates dotted and #>=# indicates a solid line) and then shade above the line. The shading is above the line because all the values of #y# above the line are greater than #-1#. The graph and shading are shown in red.

desmos

The graph of #x= -1# is a vertical line through the #x# axis.
To graph the inequality, draw a solid line (because it is #>=#) and shade to the right of the line. All #x# values to the right of the line are greater than #-1#. The graph and shading are shown in purple.

desmos

The graph of #y=-x+1# is a line in slope intercept form #y=mx+b# where #m# is the slope and #b# is the #y# intercept. Graph this line using a solid line.

To choose shading for the inequality, pick a test point not on the line. An easy point to choose is #(0,0)#. Plugging this point into the inequality gives

#0>= -(0)+1color(white)(aaa)#FALSE

This inequality is FALSE, so do not shade on the #(0,0)# side of the line. This graph and shading is shown in green.

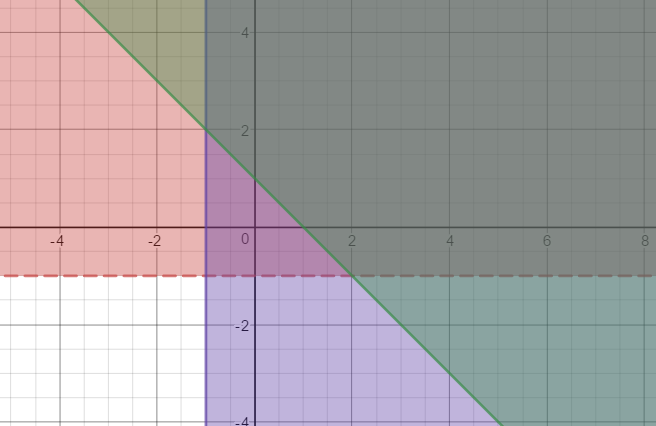
The solution to the system of inequalities is the area where all three shadings intersect, in this case the upper right area of the graph.

desmos