How do you graph #y>2^x-4#?
1 Answer

Dec 15, 2016
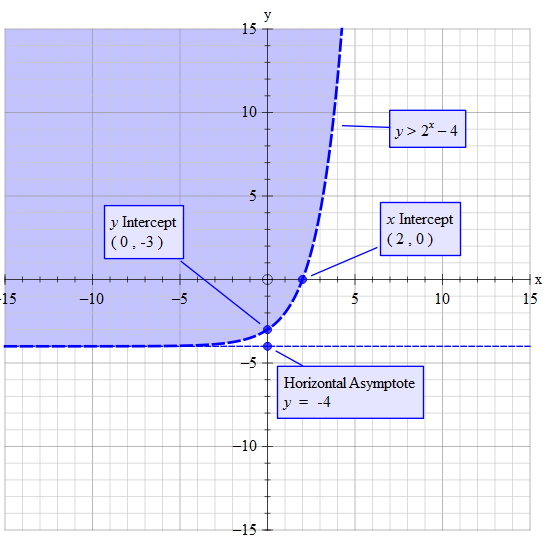
Plot
The dotted line signifies that the value of y can never actually be
Explanation:
When
When
As
As
Plot
The dotted line signifies that the value of y can never actually be
When
When
As
As
