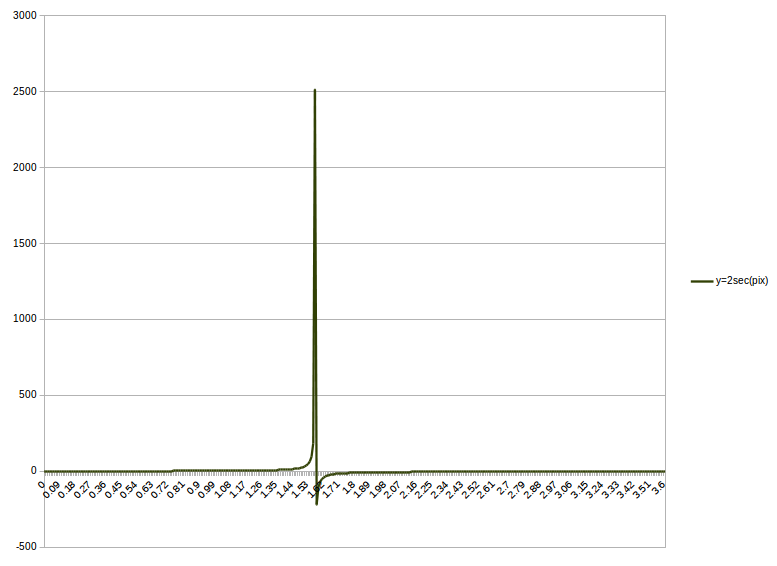
How do you graph #y=2secpix#?
1 Answer
Dec 10, 2017
ALL graphs are just the plotting of the calculated values on a chart.
Explanation:
You can do it manually or with a spreadsheet or plotting program.
Set up a table of "x" values and the corresponding "y" calculated from the expression.


