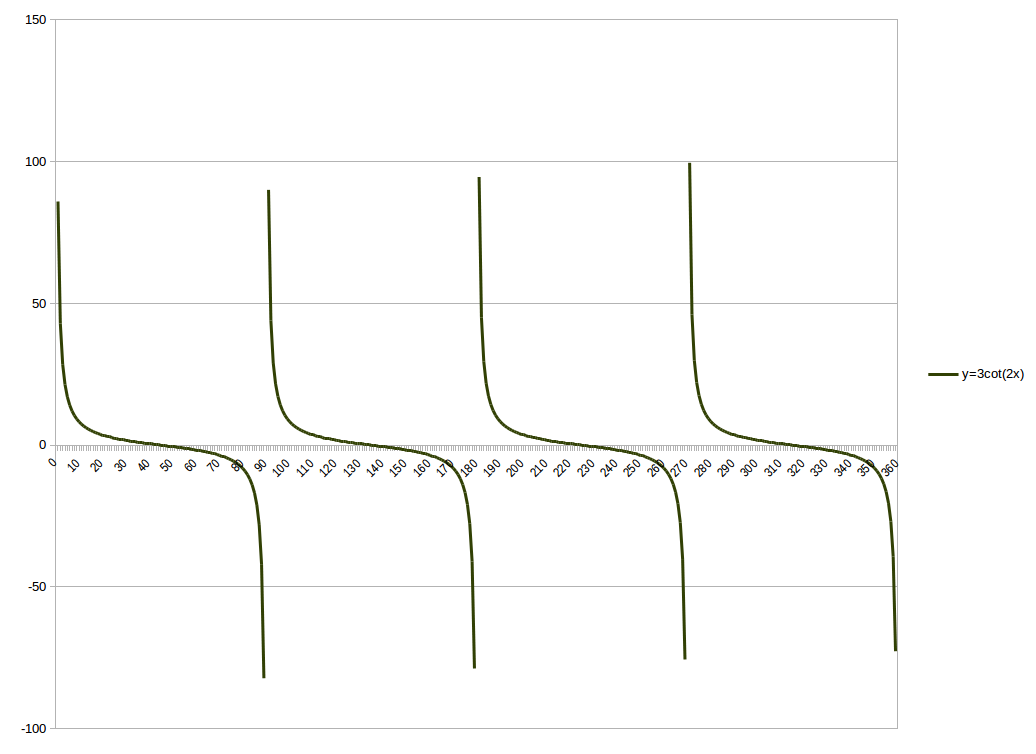
How do you graph #y=3cot(2x)#?
1 Answer

Calculate the desired number of data points, and put them on an appropriate graph paper.
Explanation:
ANY graphing or plotting must start with a table of values of the independent variable and the evaluated expression. With those values you may plot them on graph paper manually, or use a computer plotting program.
Sometimes, we just want a rough sketch, in which case recognizing the general forms of common equations such as lines, parabolas, and cubics is helpful. In this case we have a cyclic function, with discontinuities (see https://www.intmath.com/trigonometric-graphs/4-graphs-tangent-cotangent-secant-cosecant.php ).
And https://www.desmos.com/calculator/cxffgjxejh provides online graphing. http://www.dummies.com/education/math/calculus/how-to-graph-a-cotangent-function/ gives step-by-step instructions and examples.