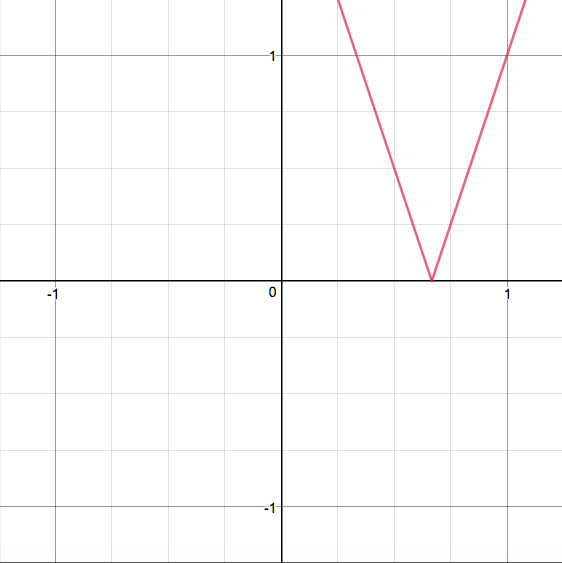
How do you graph #y=abs(3x-2)#?
1 Answer
Seperate the function into a piecewise function containing two separate functions with different domains, then graph each function with their domains.
Explanation:
Firstly, let's have a look at what the absolute value means in this case, as what is called a "piecewise function":
We could expand the negative sign over on
Having a look at the inequalities on the right side, we could simplify them. Let's start with the first one:
Add both sides by
Then divide by
And put that back:
We could be sure that the other one is solved similarly, except with a different symbol:
Since both are linear equations, we'd only need two points to plot each. Let's start by plotting the "extreme" point:
if
So we have
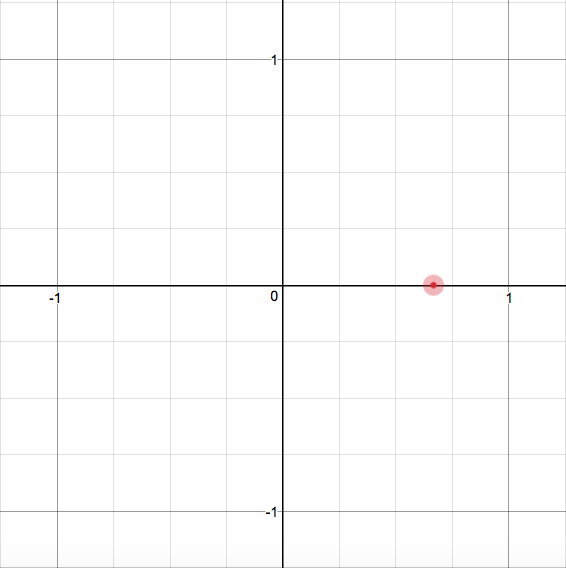
Looking at our piecewise function, we could see that the first equation should be graphed only on the right of this point, and the second equation only on the left of this point. Since this point we have plotted is part of the first equation, we just need anoter point.
Let's pick
So we have
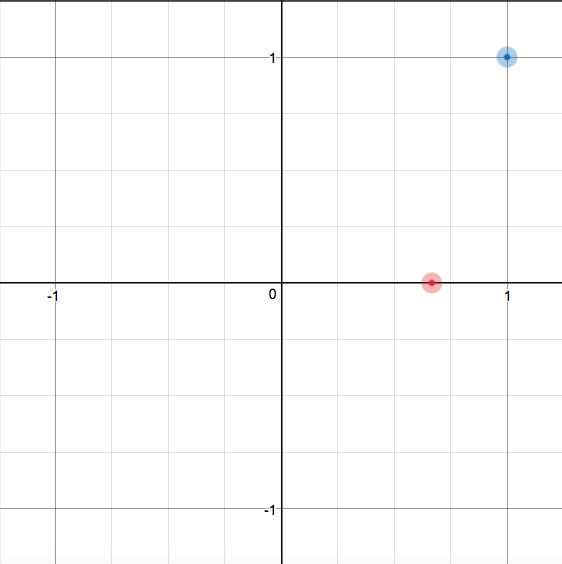
And we can connect these two points to form the first equation's line:
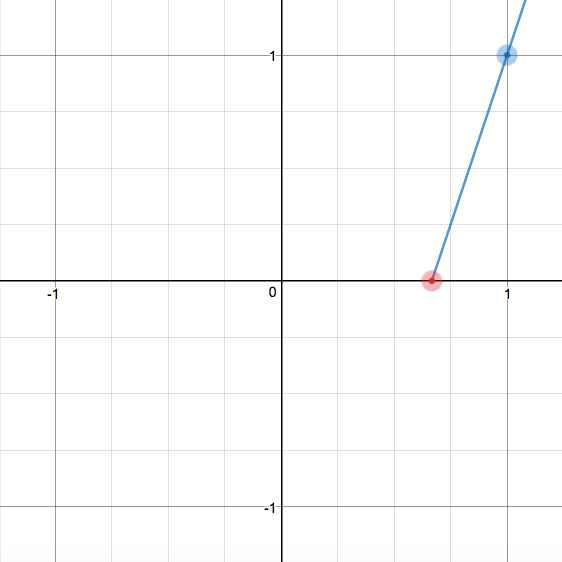
Notice, we have cut off the line by the time it reaches
Looking at the second equation, we need a number less than
So we have
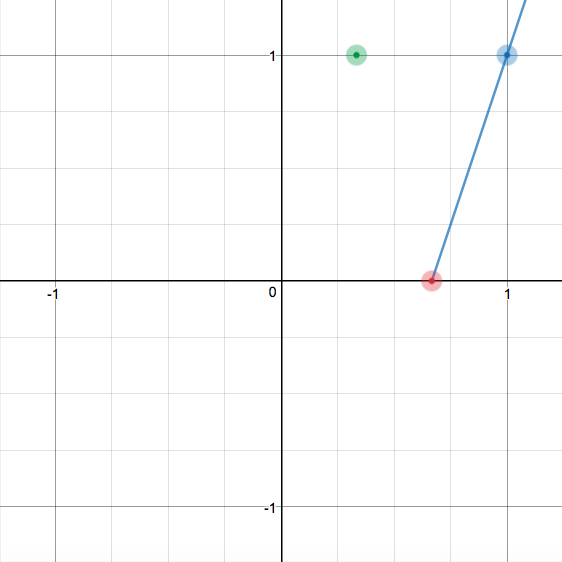
Hmm, we need another point...
Interesting! We have
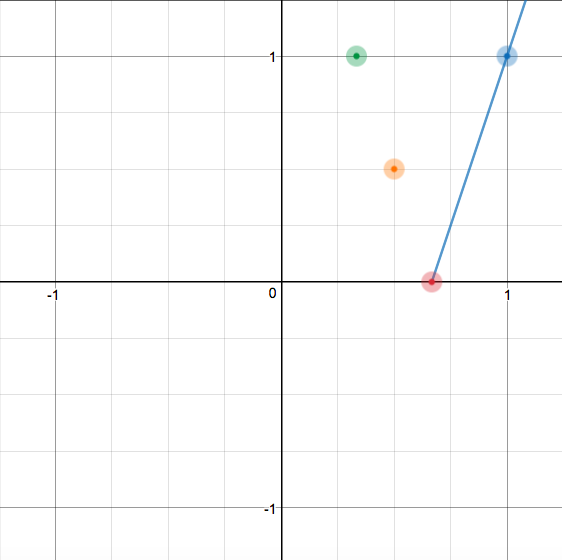
And we can connect the points to graph the second equation, also cutting it off at
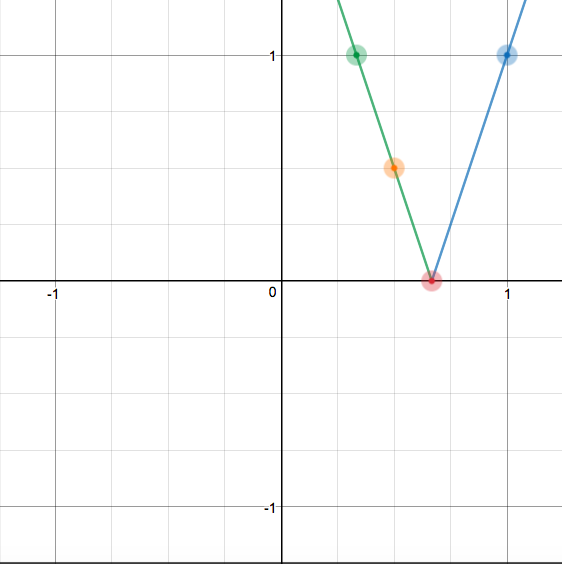
Ah, they both actually shared
