How do you graph #y=log_2(x-1)+3#?
1 Answer

Step 1: Determine the coordinates of any asymptotes, the domain and the range
Let's start with what's easiest. The range of every logarithmic function is
The domain is a little trickier. It is now that asymptotes come into play. A vertical asymptote will occur when
Hence, there will be a vertical asymptote at
Step 2: Determine any reflections, compressions, stretches and horizontal and/or vertical tranformations
This is a part that is important, but that many people choose to neglect. They will instead use a table of values, which can be helpful. But let's first look at the transformations that appear when converting the function
First, you'll notice that the graph has undergone a horizontal transformation of
Now that we know this, we can plot a table of values and understand the trend relative to
After doing this, you'll end up with the following graph:
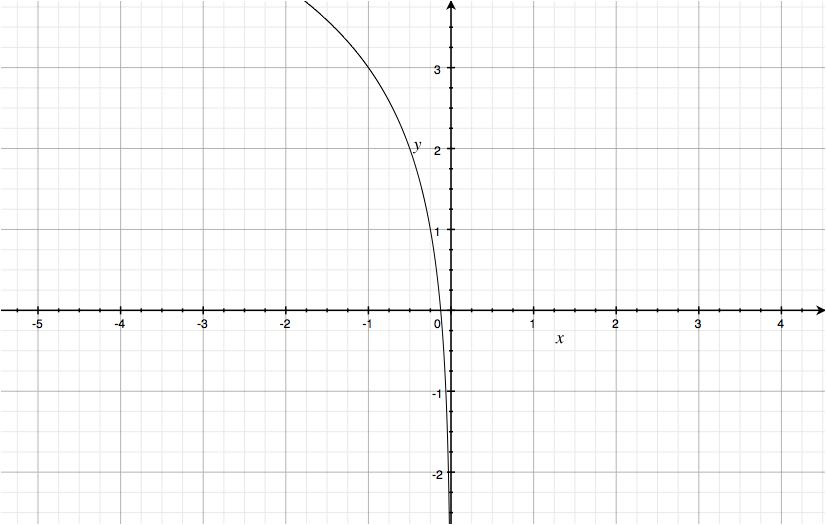
Hopefully this helps!
