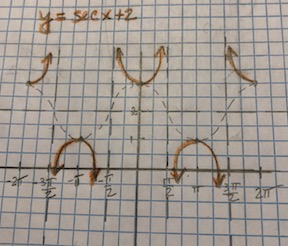
How do you graph y=secx+2?

1 Answer
Jun 14, 2018

See answer below

Explanation:

Given: y = sec x + 2

First draw a dashed vertical shift line at y = 2

Since sec x = 1/(cos x), sketch a dashed cosine function

y = cos x + 2 => " amplitude" = 1 " and period " = 2 pi

Remember that a cosine with a period of 2 pi needs to be divided into 4 sections: 0, pi/2, pi, (3pi)/2, 2 pi.

Wherever the cosine function crosses the y = 2 line there will be a vertical asymptote. At each peak and trough, there will be a point on the secant function that arcs up to the adjacent vertical asymptotes:

enter image source here