How do you graph # y<|x+2|-2#?
1 Answer

Oct 8, 2017
Explanation:
First, the graph of any absolute value equation looks like a V-shape.
In
The -2 outside of the absolute value means you go down 2 (y-axis)
The slope here is just 1 because x literally means 1x.
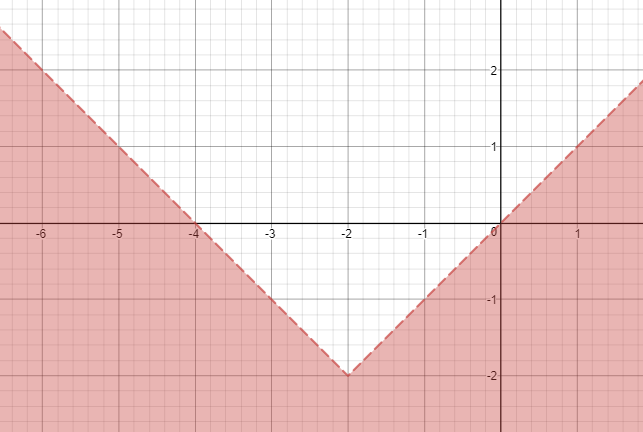
Because they want the values of y less than the expression, color everything less than that expression.
The graph looks like this:
