What is the order for the reaction 2"N"_2"O"_5(g) -> 4"NO"_2(g) + "O"_2(g)2N2O5(g)→4NO2(g)+O2(g)?
- What is the order of reaction?
- What is the concentration of
"O"_2O2 after 1010 minutes?
- What is
(Delta["NO"_2])/(Deltat) ?
- What is the half-life of
"N"_2"O"_5 ?
- What is the concentration of
"N"_2"O"_5 after 100 minutes?
- What is the order of reaction?
- What is the concentration of
"O"_2O2 after1010 minutes? - What is
(Delta["NO"_2])/(Deltat) ? - What is the half-life of
"N"_2"O"_5 ? - What is the concentration of
"N"_2"O"_5 after100 minutes?
2 Answers

Yes, graphing is the easiest way to do this (or this could be visually challenging!). In fact, learning how to use Excel is a very important skill. I've put a relatively short video on how to use Excel for chemistry here (which goes into graphs near the end):
If you JUST put time in minutes on the
But with some trial and error...
-
graphing the second order integrated rate law does not work; while it does give a positive slope, the graph is curved (not linear), and thus is of the wrong order.
-
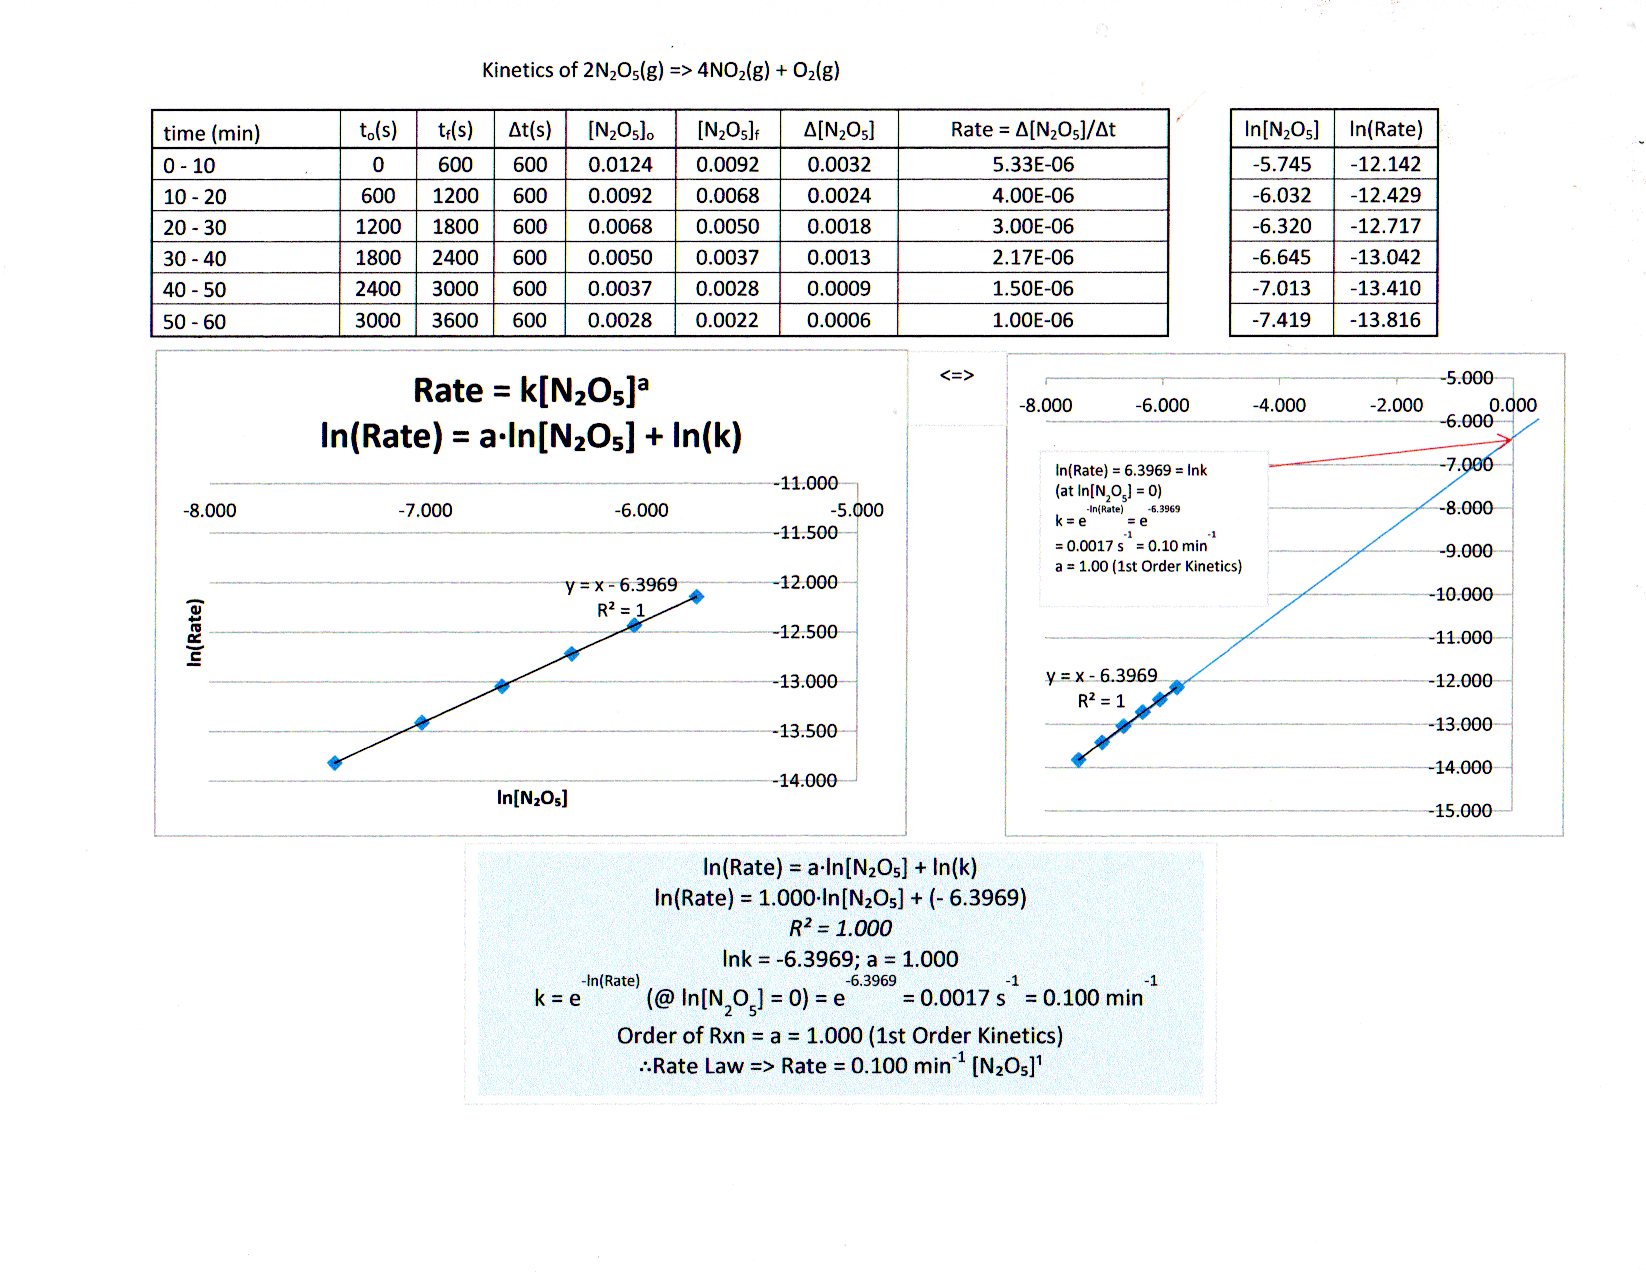
graphing the first order integrated rate law works to give a linear graph, confirming it is first order:
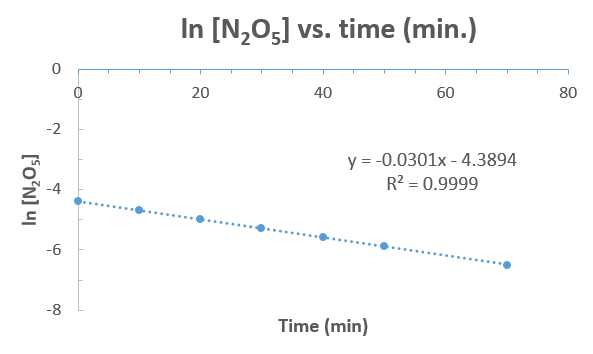
I've included the best fit line equation, which is given by:
bb(underbrace(overbrace(ln["N"_2"O"_5])^(y))_"ln of current conc." = underbrace(overbrace(-k)^(m))_"rate constant"overbrace(t)^(x) + underbrace(overbrace(ln["N"_2"O"_5]_0)^(b))_"ln of initial conc.") where
k is the rate constant,["N"_2"O"_5] is the concentration of"N"_2"O"_5 in"M" , and[" "]_0 means initial concentration. You know thatt means time in"min" .
From looking at the best fit line equation, here is what you can immediately get from it:
"slope" = -k
=> k = -"slope"
=> color(blue)(k = "0.0301 min"^(-1))
"y-int." = -4.3894
=> color(blue)(["N"_2"O"_5]_0) = e^("y-int.") = e^(-4.3894) = color(blue)("0.0124 M")
And furthermore, the rate law for this would therefore be (from knowing what the order is):
r(t) = k["N"_2"O"_5]
This may or may not be a new concept, but let's consider something called an ICE Table (initial, change, equilibrium), which is normally a way to track the changes in concentration in a reaction on its way to "equilibrium", the point when the reaction has the same rate forwards and backwards.
In the ICE Table below, the coefficients in front of
2"N"_2"O"_5(g) -> 4"NO"_2(g) + "O"_2(g)
"I"" ""0.0124 M"" "" ""0 M"" "" "" ""0 M"
"C"" "-2x" "" "" "+4x" "" "" "+x
"E"" ""0.0092 M"" "" "4x" "" "" "" "x
Well, we can track the progress of the reaction using the reaction quotient,
Since we know that the change in concentration of
And since
r(t) = k["N"_2"O"_5]
r(t) = 3.735 xx 10^(-4) "M/min" = |overbrace(-)^"consumption"1/2 overbrace((Delta["N"_2"O"_5])/(Deltat))^"Initial rate"|
= overbrace(+)^"production"1/4 overbrace((Delta["NO"_2])/(Deltat))^"Initial rate"
So, it is:
color(blue)((Delta["NO"_2])/(Deltat)) = 4/2 xx 3.735 xx 10^(-4) "M/min"
= color(blue)(7.47 xx 10^(-4) "M/min")
ln["N"_2"O"_5] = -kt + ln["N"_2"O"_5]_0
First, plug in
ln(1/2["N"_2"O"_5]_0) = -kt_"1/2" + ln["N"_2"O"_5]_0
Now use the property that
ln\frac(1/2cancel(["N"_2"O"_5]_0))(cancel(["N"_2"O"_5]_0)) = -kt_"1/2"
=> -ln2 = -kt_"1/2"
Thus, the first-order half-life is given by:
=> color(green)(t_"1/2" = (ln2)/k)
And now, we can get:
color(blue)(t_"1/2") = (ln2)/("0.0301 min"^(-1))
= color(blue)("23.03 min")
"100 mins passed"/"23.03 min half-life" ~~ 4.34 half-lives passed.
Therefore, the initial concentration
This means the concentration after
color(blue)(["N"_2"O"_5]_("100 min.")) = "0.0124 M" xx 1/(2^(4.34)) ~~ color(blue)(6.11 xx 10^(-4) "M")
(or

Kinetic Rate Law for Decomposition of
Explanation:
Kinetics of