What is the graph of #f(x) = x^2#?
1 Answer

Sep 13, 2014
The graph of
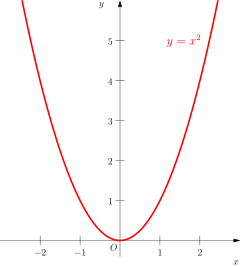
One of the ways to graph this is to use plug in a few x-values and get an idea of the shape. Since the x values keep getting squared, there is an exponential increase on either side of the y-axis. You can see this by plugging in a few values:
When
The same holds true for negative x-values to the left of the y-axis since a negative value squared is positive. For example,
