How do you graph using slope and intercept of #2x+y=8#?

1 Answer
Oct 16, 2017

enter image source here
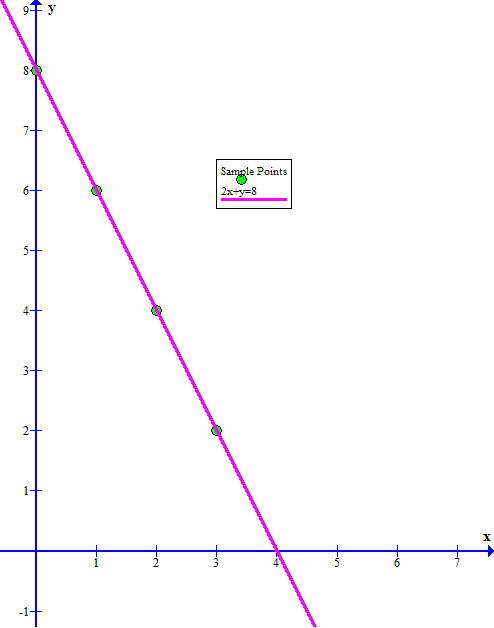
(see below for method used in generating this graph)

Explanation:

The slope of a line in the form #Ax+By=C# is #(-A/B)#

The y-intercept is the value of #y# when #x=0#

In this case #2x+y=8#
#color(white)("XXX")# slope #= -2/1=-2#
and
#color(white)("XXX")# the #y# intercept is #8# (since #2xx0+y=8 rarr y=8#)

Based on the #y#-intercept we know that one point on the line is at #(x,y)=(0,8)#

The slope of #(-2)# tells us that for every unit increment (i.e. #+1#) of the #x# value, the #y# value changes by #(-2)#

So we can build a table of a few Sample points:
#color(white)("XXX"){:(ul(x),color(white)("xxx"),ul(y)),(0,,8),(1,,6),(2,,4),(3,,2) :}#

Plotting these coordinates on the Cartesian plane and drawing a straight line through them should give a graph that looks like the Answer above.