How do you graph to solve the equation on the interval #[-2pi,2pi]# for #cscx=sqrt2#?

1 Answer
Nov 13, 2017

See below.

Explanation:

enter image source here

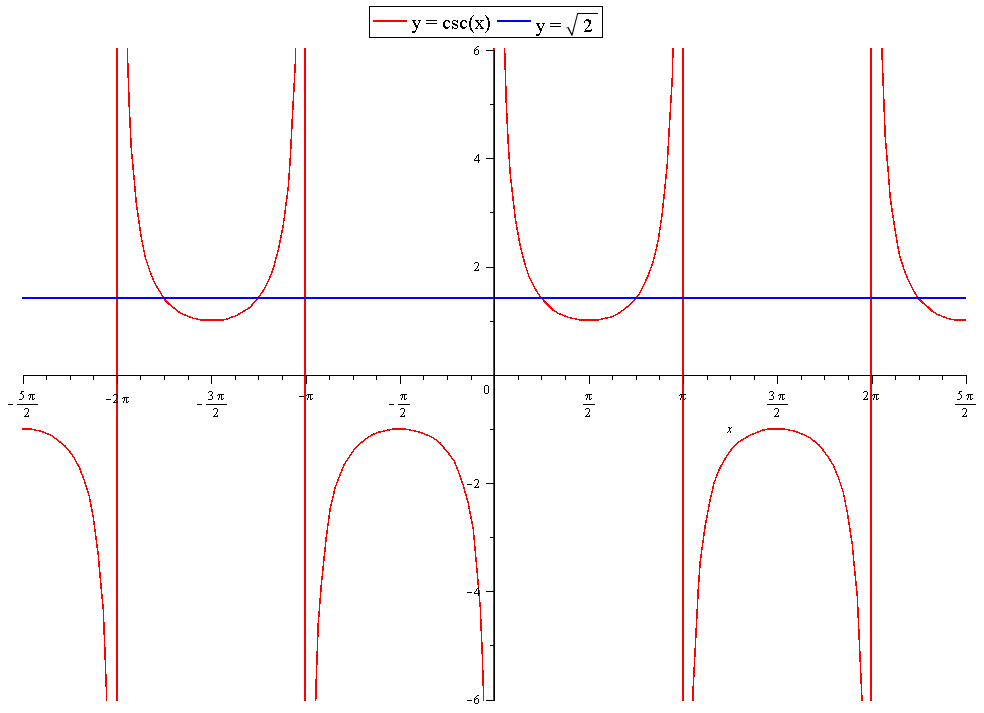
Since you will be graphing #y=csc(x)# this is the same as #y=1/cosx#

Notice from the graph that the vertical lines are asymptotes. This is because #y=1/cosx# is undefined anywhere #cosx=0#.

( this results in division by zero ).

Graph the line #y = sqrt(2)# on the same plot. Where #y=sqrt(2)# cuts the curves, not the asymptotes, are the solutions to #cscx=sqrt(2)#. It's very difficult to get accurate solutions from a graph though.