#y=(x+1)^2+3# , is in the form:
#y=a(x-h)^2+k#
Where a is the coefficient of #x^2#, h is the axis of symmetry and k is the maximum/minimum value.
Notice that a #=1# is positive, so the parabola will be of this form: #uuu#. This means it has a minimum value.
The minimum or maximum value always occurs where the #x# coordinate is #h# and the #y# coordinate is #k# i.e.:
#(h,k)#
From our equation this is:
#color(blue)((-1 ,3)#
Notice that #h=-1# and not #1#. This is because we have #(x-h)^2#, so when #h# is negative, #(x-(-1))^2=(x+1)^2#
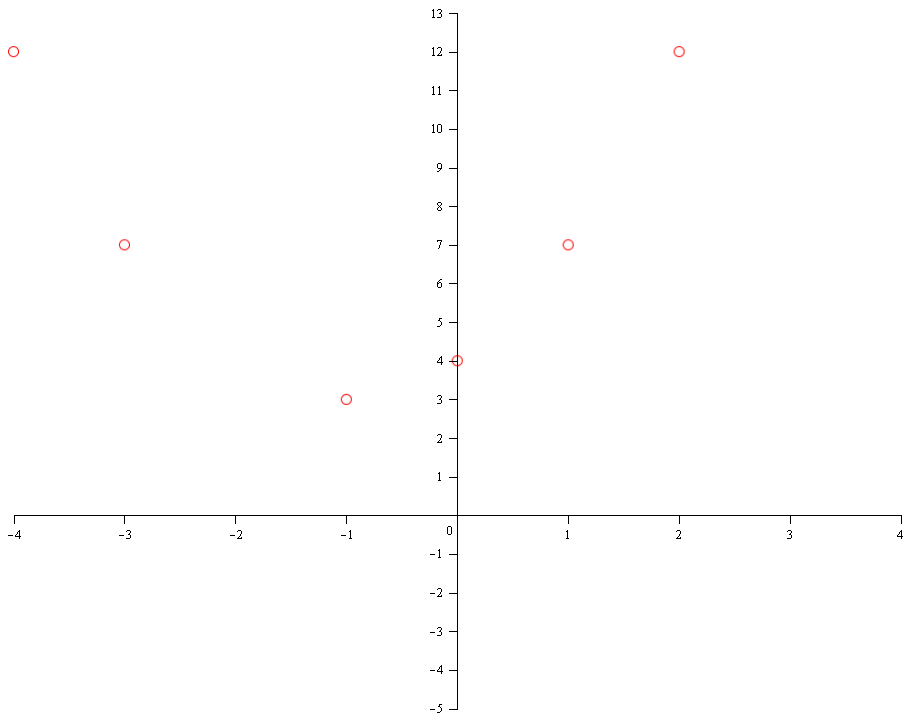
This coordinate can be used for graphing. Other useful points are:
#y# axis intercept occurs when #x=0#
#y=((0)+1)^2+3=4#
coordinate:
#color(blue)((0,4)#
#x# axis intercepts occur when #y=0#:
#(x+1)^2+3=0#
#(x+1)^2=-3#
#x=-1+sqrt(-3)# ( This is a non real value, so no x axis intercepts ).
Other point for graphing will have to be found by plugging in values for #x# and calculating the corresponding values of #y#.
Values could be:
#x=1->(1+1)^2+3=7->color(blue)((1,7)#
#x=2->(2+1)^2+3=12->color(blue)((2,12)#
#x=-3->(-3+1)^2+3=7->color(blue)((-3,7)#
#x=-4->(-4+1)^2+3=12->color(blue)((-4,12)#
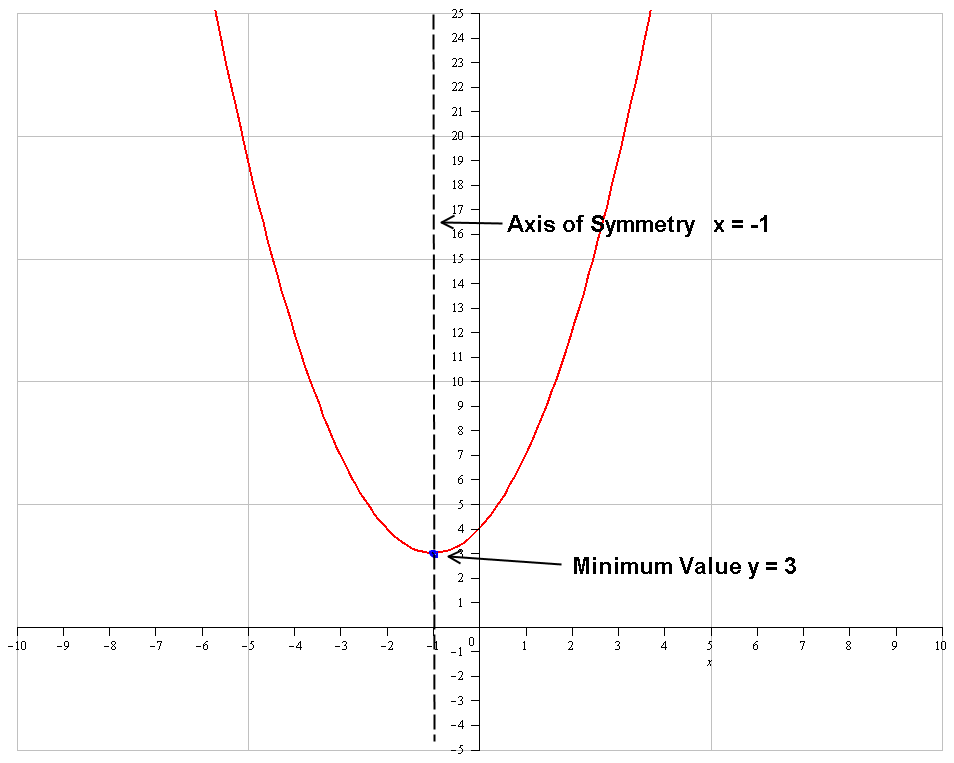
The more points you plot the more accurate the curve will be:
Join the points and mark the axis of symmetry ( You could use a dashed line for this ). Mark the minimum value ( You can use a dot for this ).