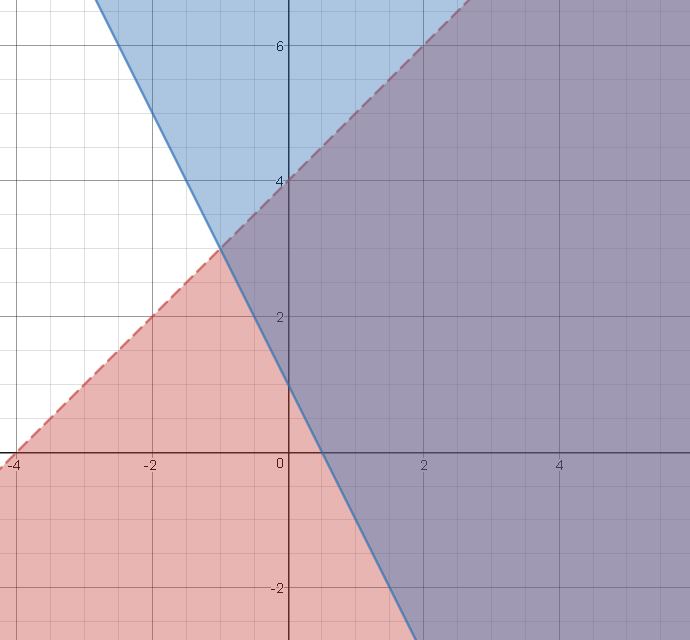
How do you graph the system of linear inequalities y<x+4 and y>=-2x+1?
1 Answer

Aug 3, 2018
See explanation.
Explanation:
First treat the < or > signs like an equal sign for now. Start at the y- intercept and then use the slope to draw each of the lines.
Now that you have the line drawn look at the inequality signs that you have.
since this one has a
Since this one has a
The actual answer is where each of the shaded regions touch meet.
