How do I use a sign chart to solve #x^2+5x-9<0#?

1 Answer
Jun 8, 2018

# x^2+5x-9 <0# when #x in (-6.4051, 1.4051)#

Explanation:

First, we want to find what the zeros of the function are.

#"Let " f(x) = x^2+5x-9#

#x = frac{-b +- sqrt(b^2 - 4ac)}{2a}#

#x = frac{-5 +- sqrt(5^2-(4)(-9))}{(2)(1)}#

#x = frac{-5+-sqrt(25+36)}{2}#

#x=frac{-5 +-sqrt61}{2}#

#x = 1.4051", "x = -6.4051#

Now, make a number line that includes these values, like the one below.

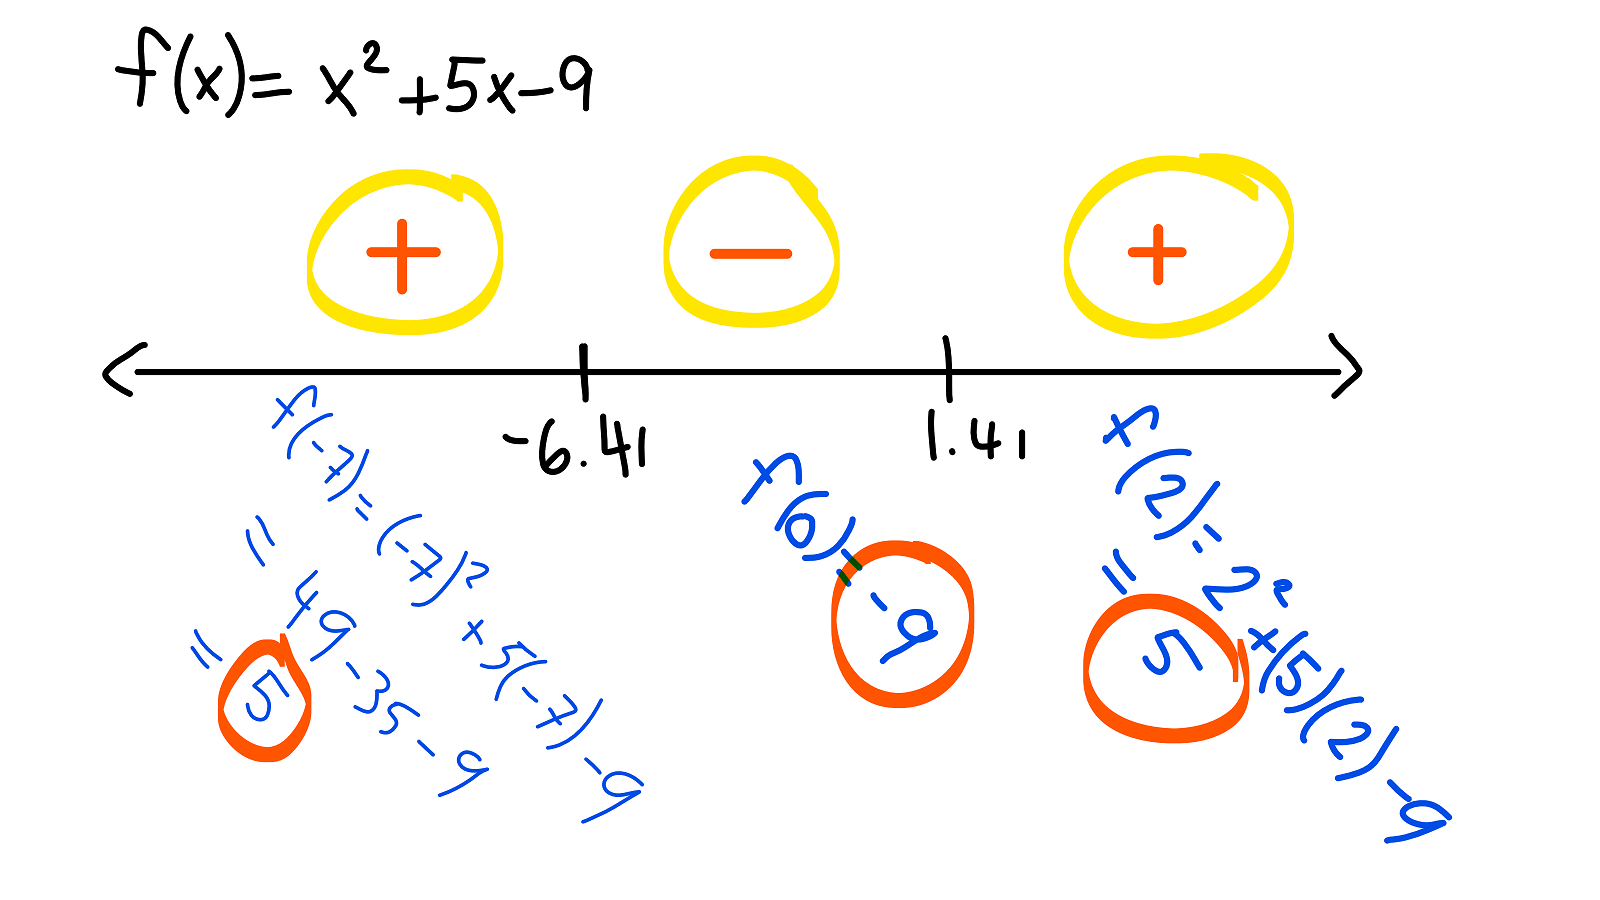
To make the sign chart, plug in values that fall within the specified interval - I tend to pick easy numbers for which I can do calculations in my head.

The original equation is an inequality. We need to find where #f(x) <0#. This occurs where #f(x)# is negative, which is in the interval from #(-6.4051,1.4051)#. This interval makes sense because when we graph it, the parabola drops below the x-axis in this interval, as shown below.

graph{x^2+5x-9 [-28.86, 28.87, -14.43, 14.43]}