How do you graph basic polar equations?
1 Answer

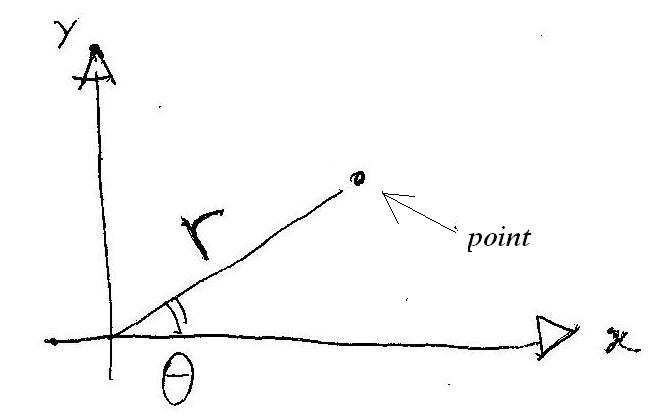
You consider a function of the type:
So you give values of the angle
To graph polar functions you have to find points that lie at a distance
Take for example the polar function:
This function describes points that for every angle
Graphically:
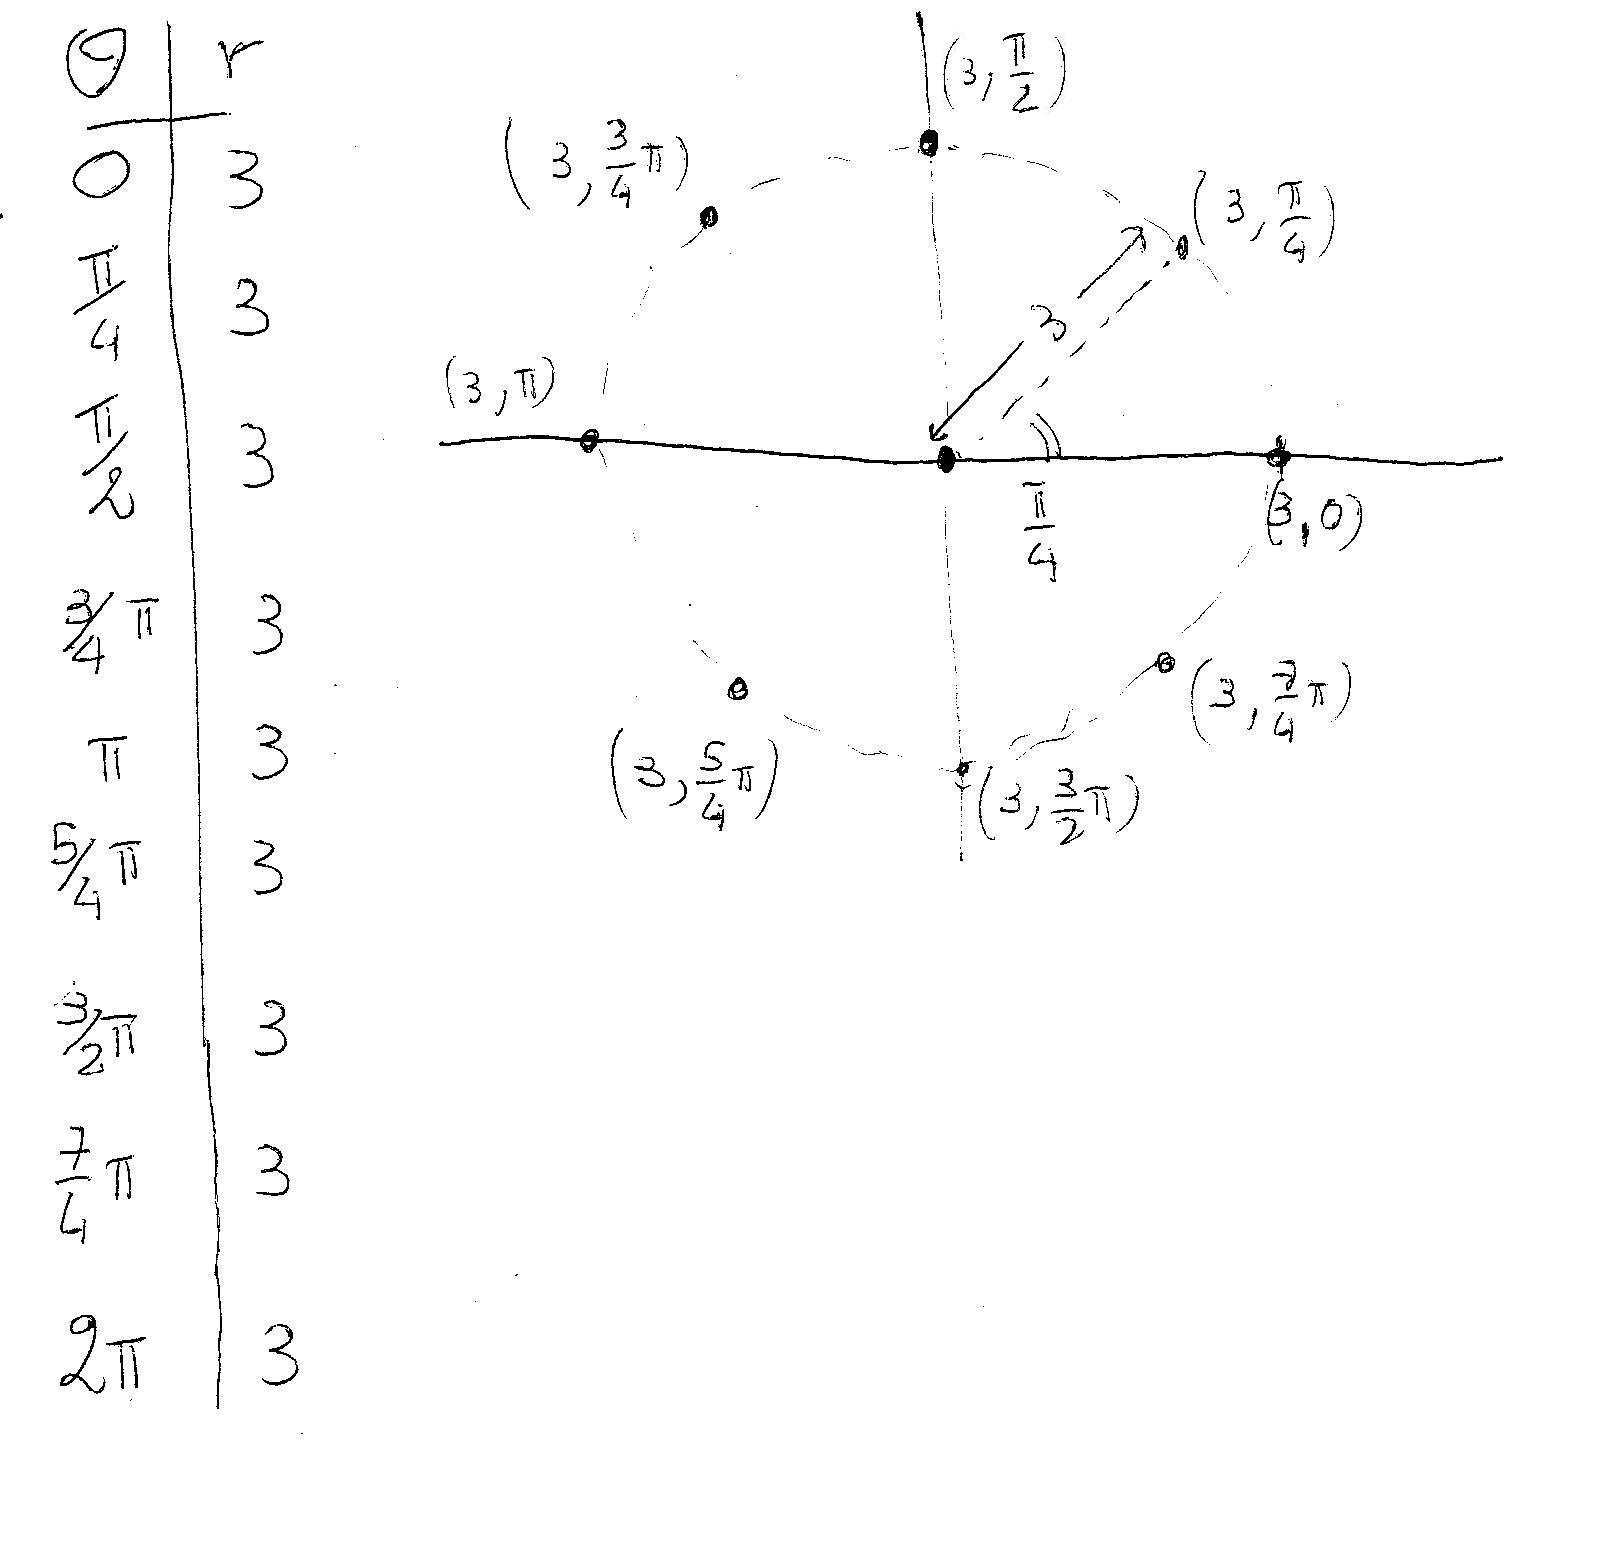
The result is a circle of radius
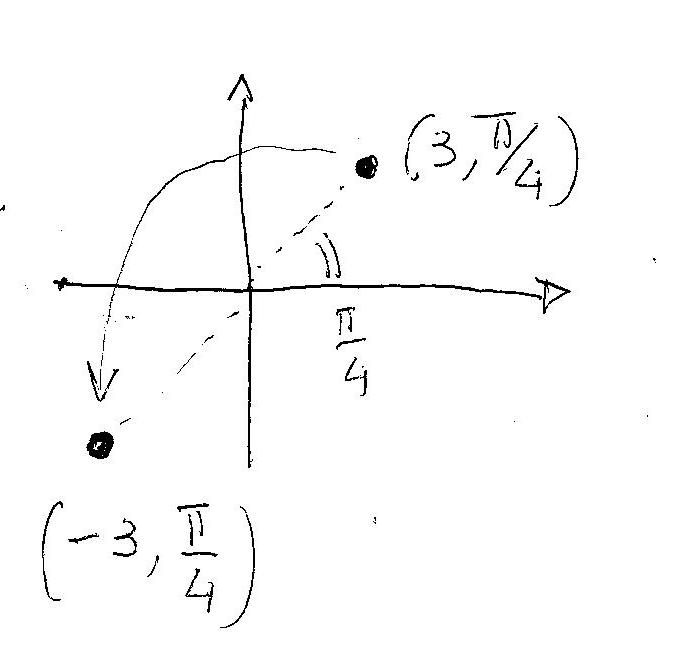
Now, the only complication is when
We use a trick....we take the positive and flip it about the origin!!!!!!
Take for example the polar function:
This function describes points that for every angle
We use our trick!
Graphically:
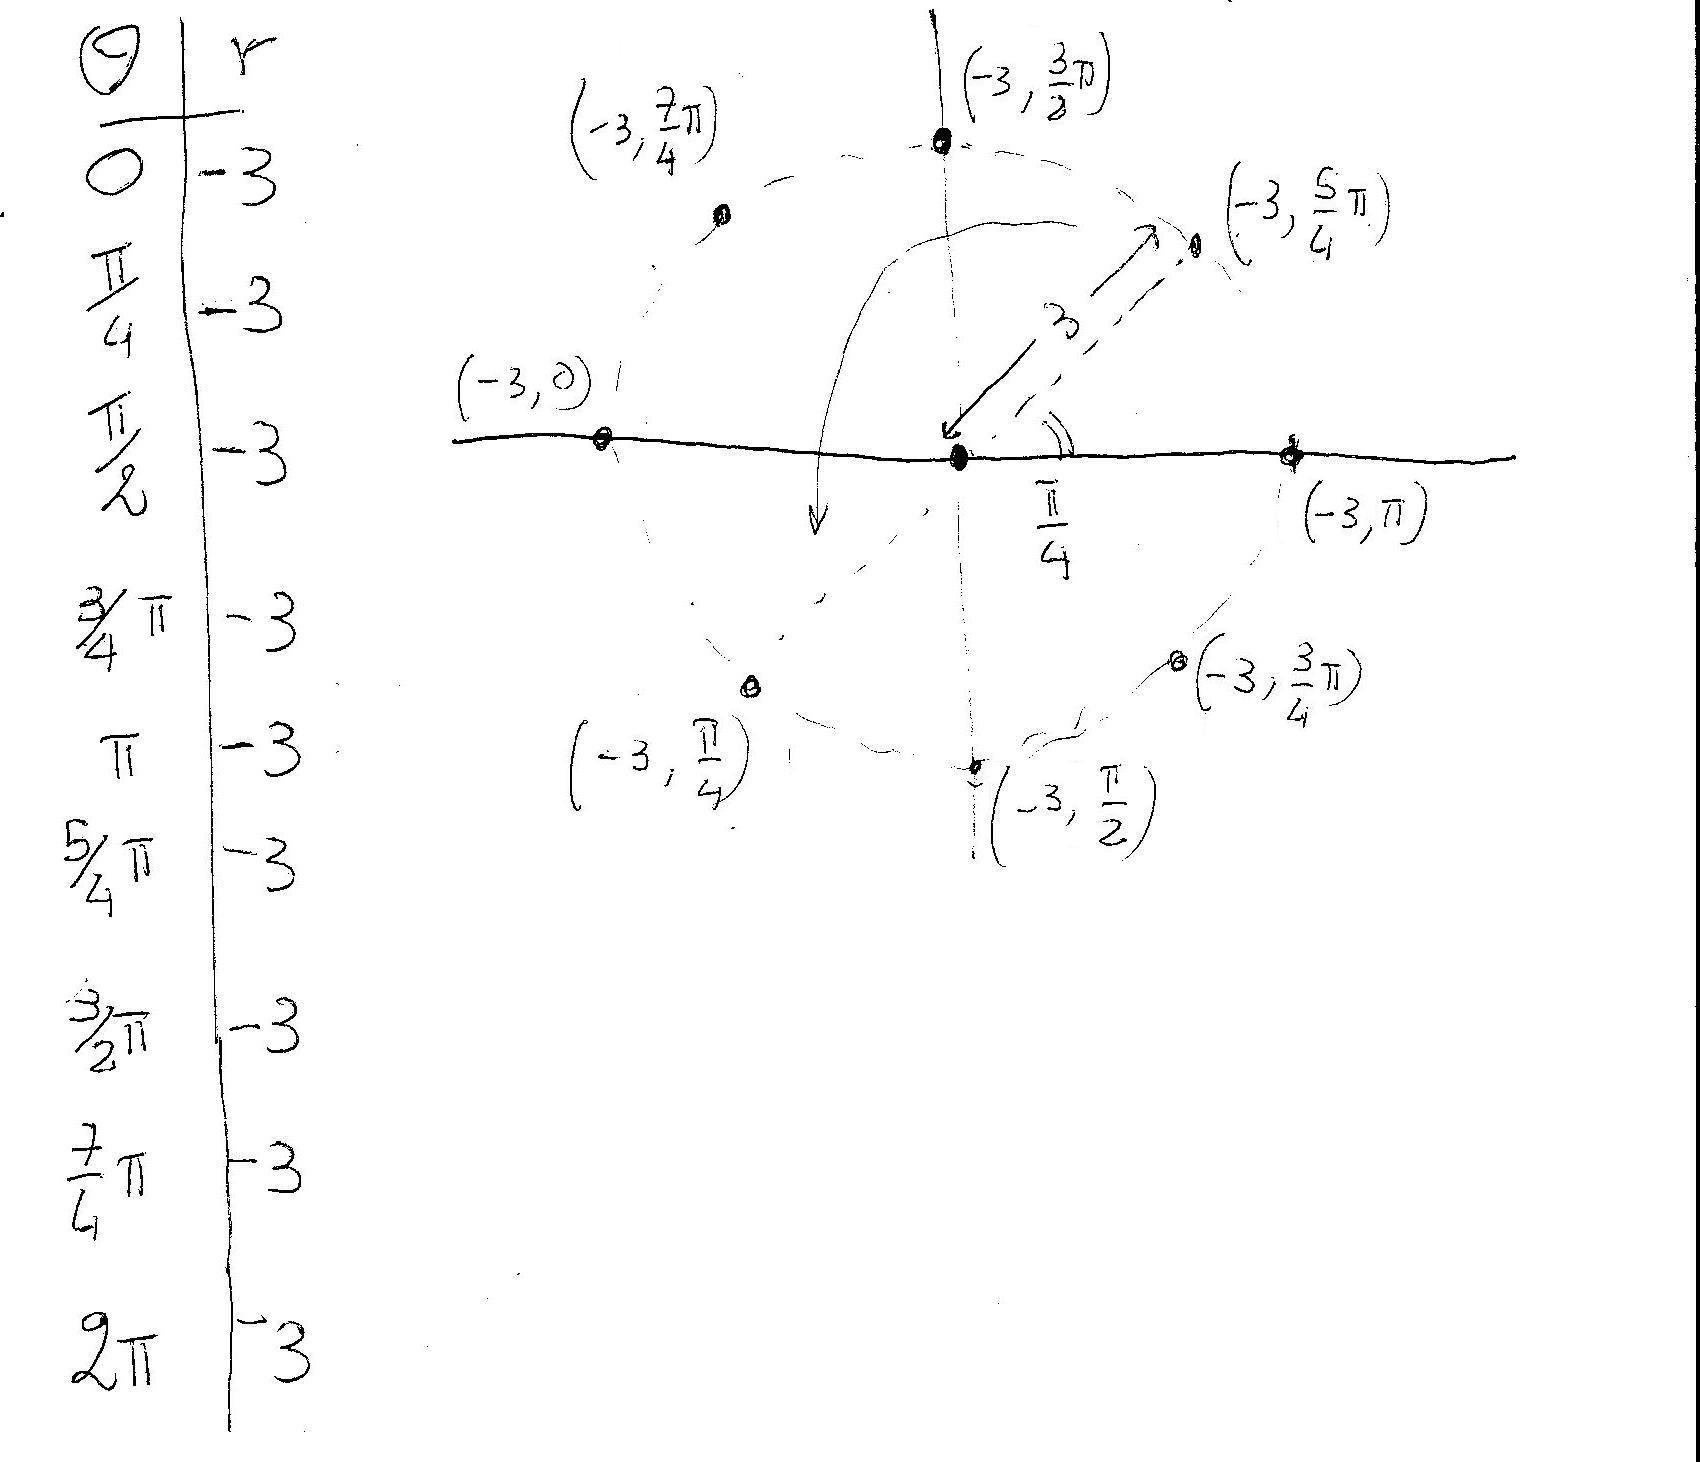
Every point of the old graph flipped about the origin!!!!
It is a circle...again!!!!
Now try by yourself with:
Build a table of
There are more complicated (and graphically beautiful) polar functions such as limacons, cardioids, roses, lemniscates, etc…try them!!!
