What does the graph of #r = \cos \theta# such that #0^\circ \le \theta \le 360^\circ# look like?
1 Answer
Dec 28, 2014
I used Excel to plot your graph and I got:
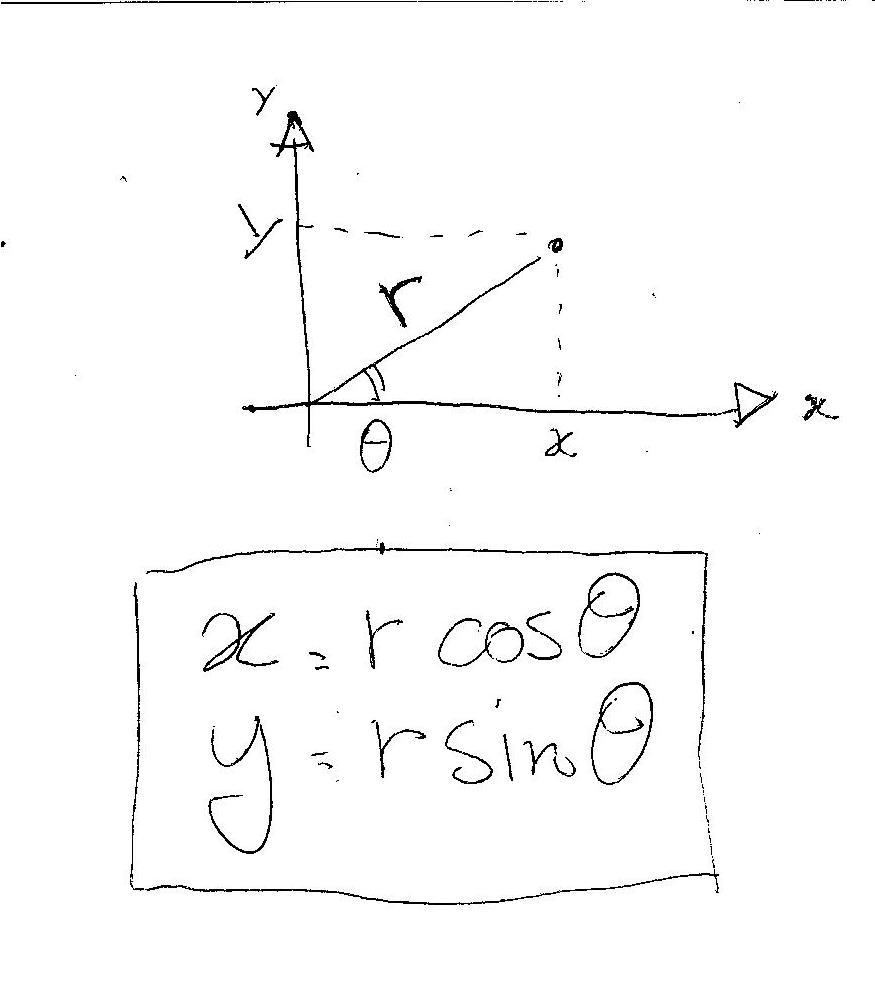
In the first two columns you have for each angle
The next two columns contain the corresponding values of
To obtain the values in the

(hope it helped)

