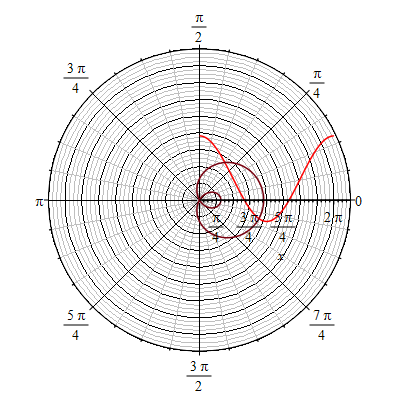
The curve in red is the plot of #1+2cos(theta)# and the one in purple is the plot of #r=1+2cos(theta)#. The purple is drawn from the red. Starting from positive #x -ax\is#, the purple curve goes from #r=3# at #theta = 0# and decreases until it goes to zero, then decreases further until the minimum #r=-1# at #theta = pi#, then increases and goes back to zero, and continues increasing until reaching another maximum #r=3# at #theta = 2*pi#.