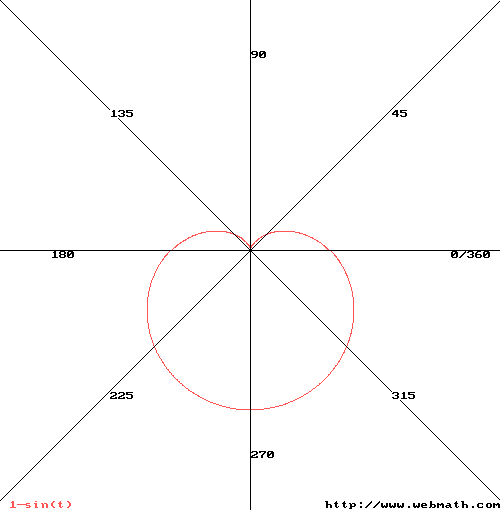
How do you graph #r = 1-sin(theta)#?
2 Answers
Below
Explanation:
First of all, draw your
graph{sin x [-10, 10, -5, 5]}
Since it has a negative sign at the front, you flip it on its x-axis
graph{-sinx [-10, 10, -5, 5]}
Since it has the 1 at the front, all you have to do is shift the graph up by 1 unit.
graph{1-sinx [-10, 10, -5, 5]}
Make a table of θ and calculated r values. Plot them on graph paper or use a suitable computer program.
Explanation:
ALL graphing must start with the calculation/collection of the relevant points! After that, it is just a question of putting them into the format (Cartesian or Polar) that is most appropriate.
Maybe the problem is that not very many computer programs can do polar plots easily. One can still be constructed quickly from the table of values, which can still be generated very quickly with a spreadsheet program.
Printable Polar Graph Paper available here:
https://www.printablepaper.net/category/polar_graph
Graphing Calculator here:
http://www.webmath.com/polar.html


