How do you graph #r^2=2sin(3θ)#?

1 Answer

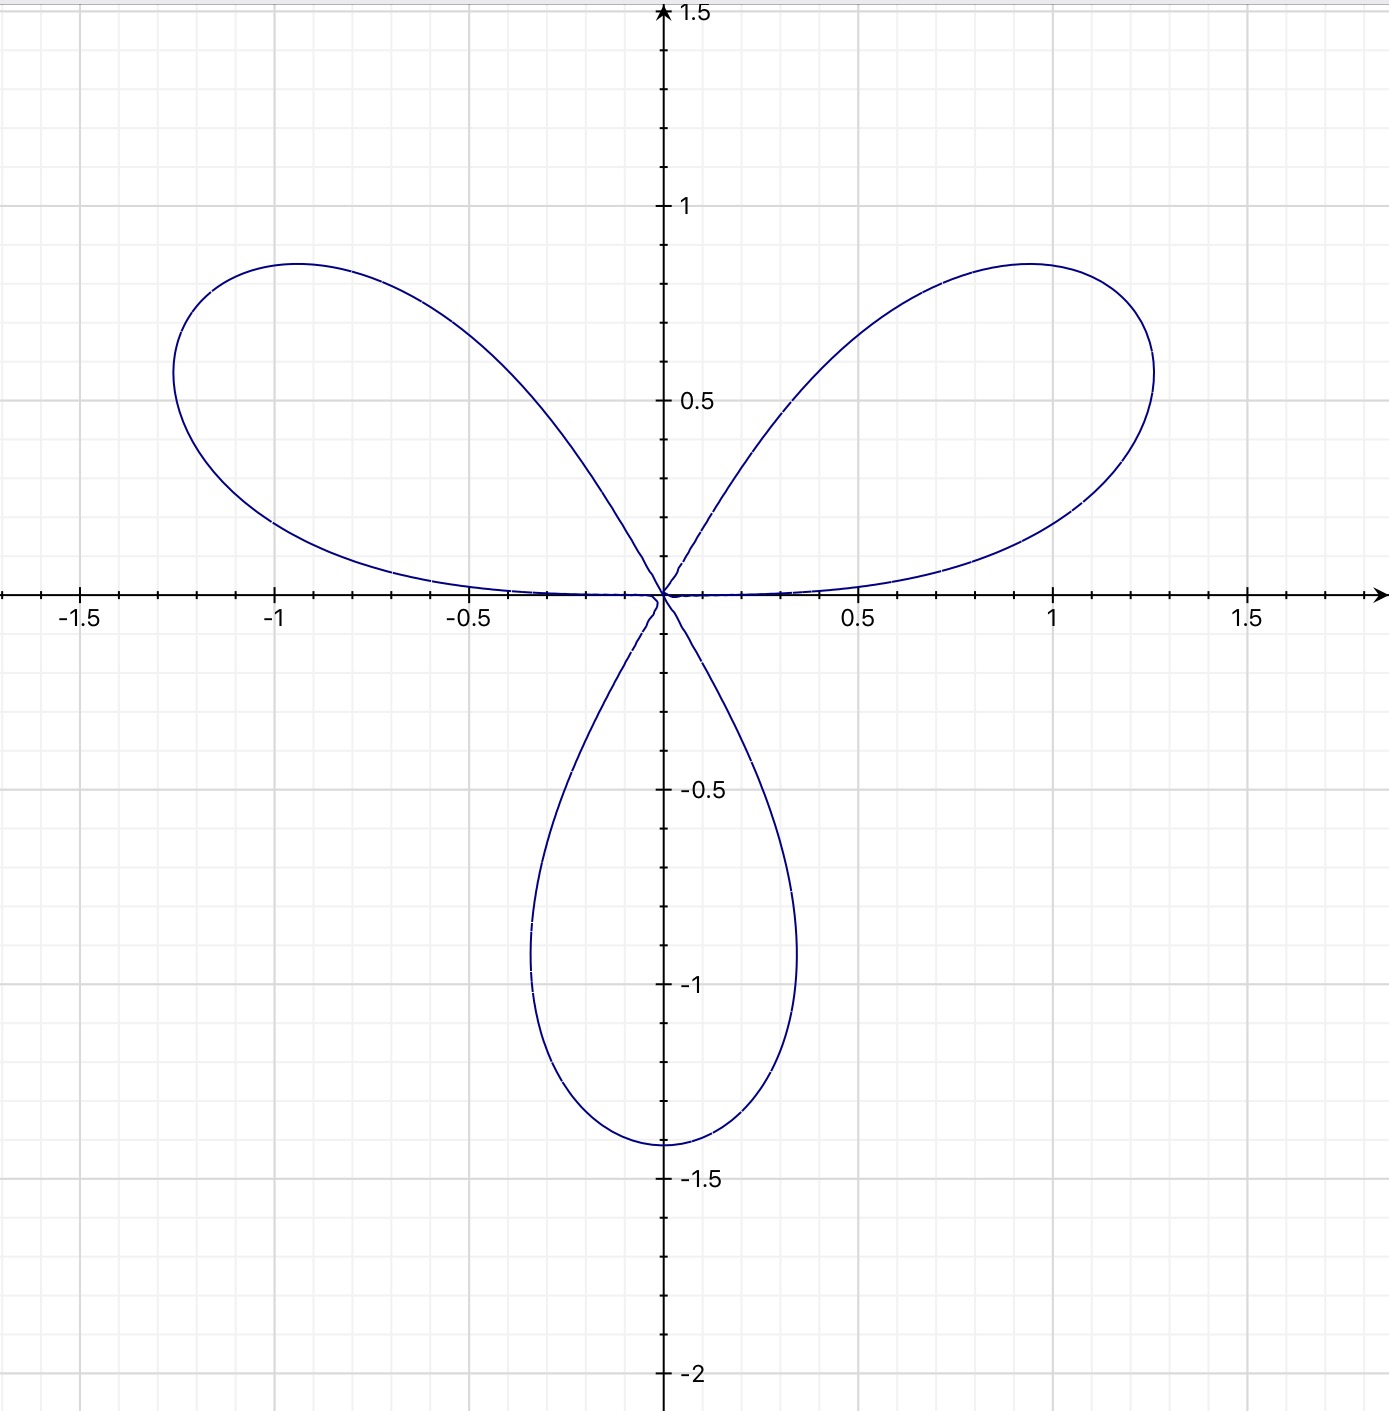
Thanks to Sam's updating, it is a 3-petal curve, without using non-negative r, For the three loops, choose the ranges #theta in [0, pi/3] , [(2pi)/3, pi] and [(4pi)/3, (5pi)/3]#..

Explanation:

Upon insertion of the graph by Sam, I have duly revised my answer,

to make the answer almost perfect..

enter image source here

#r^2 = 2 sin 3theta >=0#. Maximum r = 2.

Choose the range # theta in [0, pi/3]#,

so that #3 theta in [0, pi]# is in the first two quadrants, where sine is

positive. It is similar, for the the other two petals, in the respective

ranges for #theta#....

For every #sin 3theta, r=+-sqrt(2 sin 3theta)#

(If negative r is allowed, there would be six loops altogether, keeping #2 sin 3theta>=0#. For the range #theta in [0, pi/3]#, one loop traced by the (+r)-hand, is in the first quadrant, and its mirror image about the pole, traced with the (-r)-hand, is in the third quadrant. If the convention is to treat r as modulus (length) of a vector, r# >=# 0, the mirror images are not done.)

As the period of #2 sin 3theta# is #(2pi)/3# the petals are retraced

when the ends of the intervals for #theta# are increased by integer

multiple #n((2pi)/3)# of #(2pi)/3#...