How do you graph #r = 3 + 3cosθ#?

1 Answer
May 13, 2016

Explanation is given below

Explanation:

For graphing this polar curve, it has to be seen, how the value of r behaves as #theta# goes on increasing. It can be done as follows;

Starting with #theta# =0 along x axis, r= 6. As #theta# would increase r would decrease, because #costheta# would go on decreasing.

At #theta = pi/2#, r= 3.

As #theta# would increase further, r would get lesser and lesser and at #theta= pi# , r=0.

At #theta= (3pi)/2#, r would be 3 and finally at #theta 2pi#, r would be 6 again

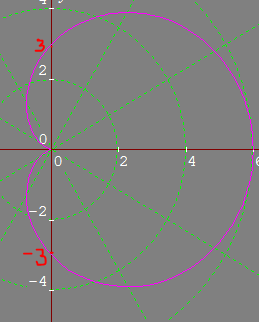
Having determined the values of r.\, the curve can be sketched as shown below.
enter image source here