How do you graph the polar equation #r=1.5theta#?
1 Answer

Polar equations vary
#r = 1.5theta#
This equation has
Here, with
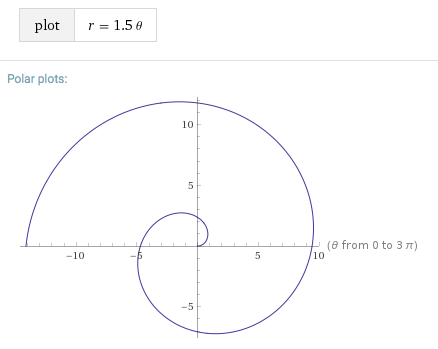
For example, if you look at
#r = 1.5 xx pi/2 ~~ ul2.35# on the vertical axis.
If we pass through
#r = 1.5 xx (pi/2 + pi/2) => ul(-4.71)# on the horizontal axis
If we pass through
#r = 1.5 xx (pi/2 + pi) => ul(-7.07)# on the vertical axis.
If we pass through
#r = 1.5 xx (pi/2 + (3pi)/2) ~~ ul9.42# on the horizontal axis.
Then, if we pass through
#r = 1.5 xx (pi/2 + 2pi) ~~ ul11.78# on the vertical axis.
Once you have those major points, connect them in a spiral.
